AIIMS Unveiled: A Visual Symphony of Numbers

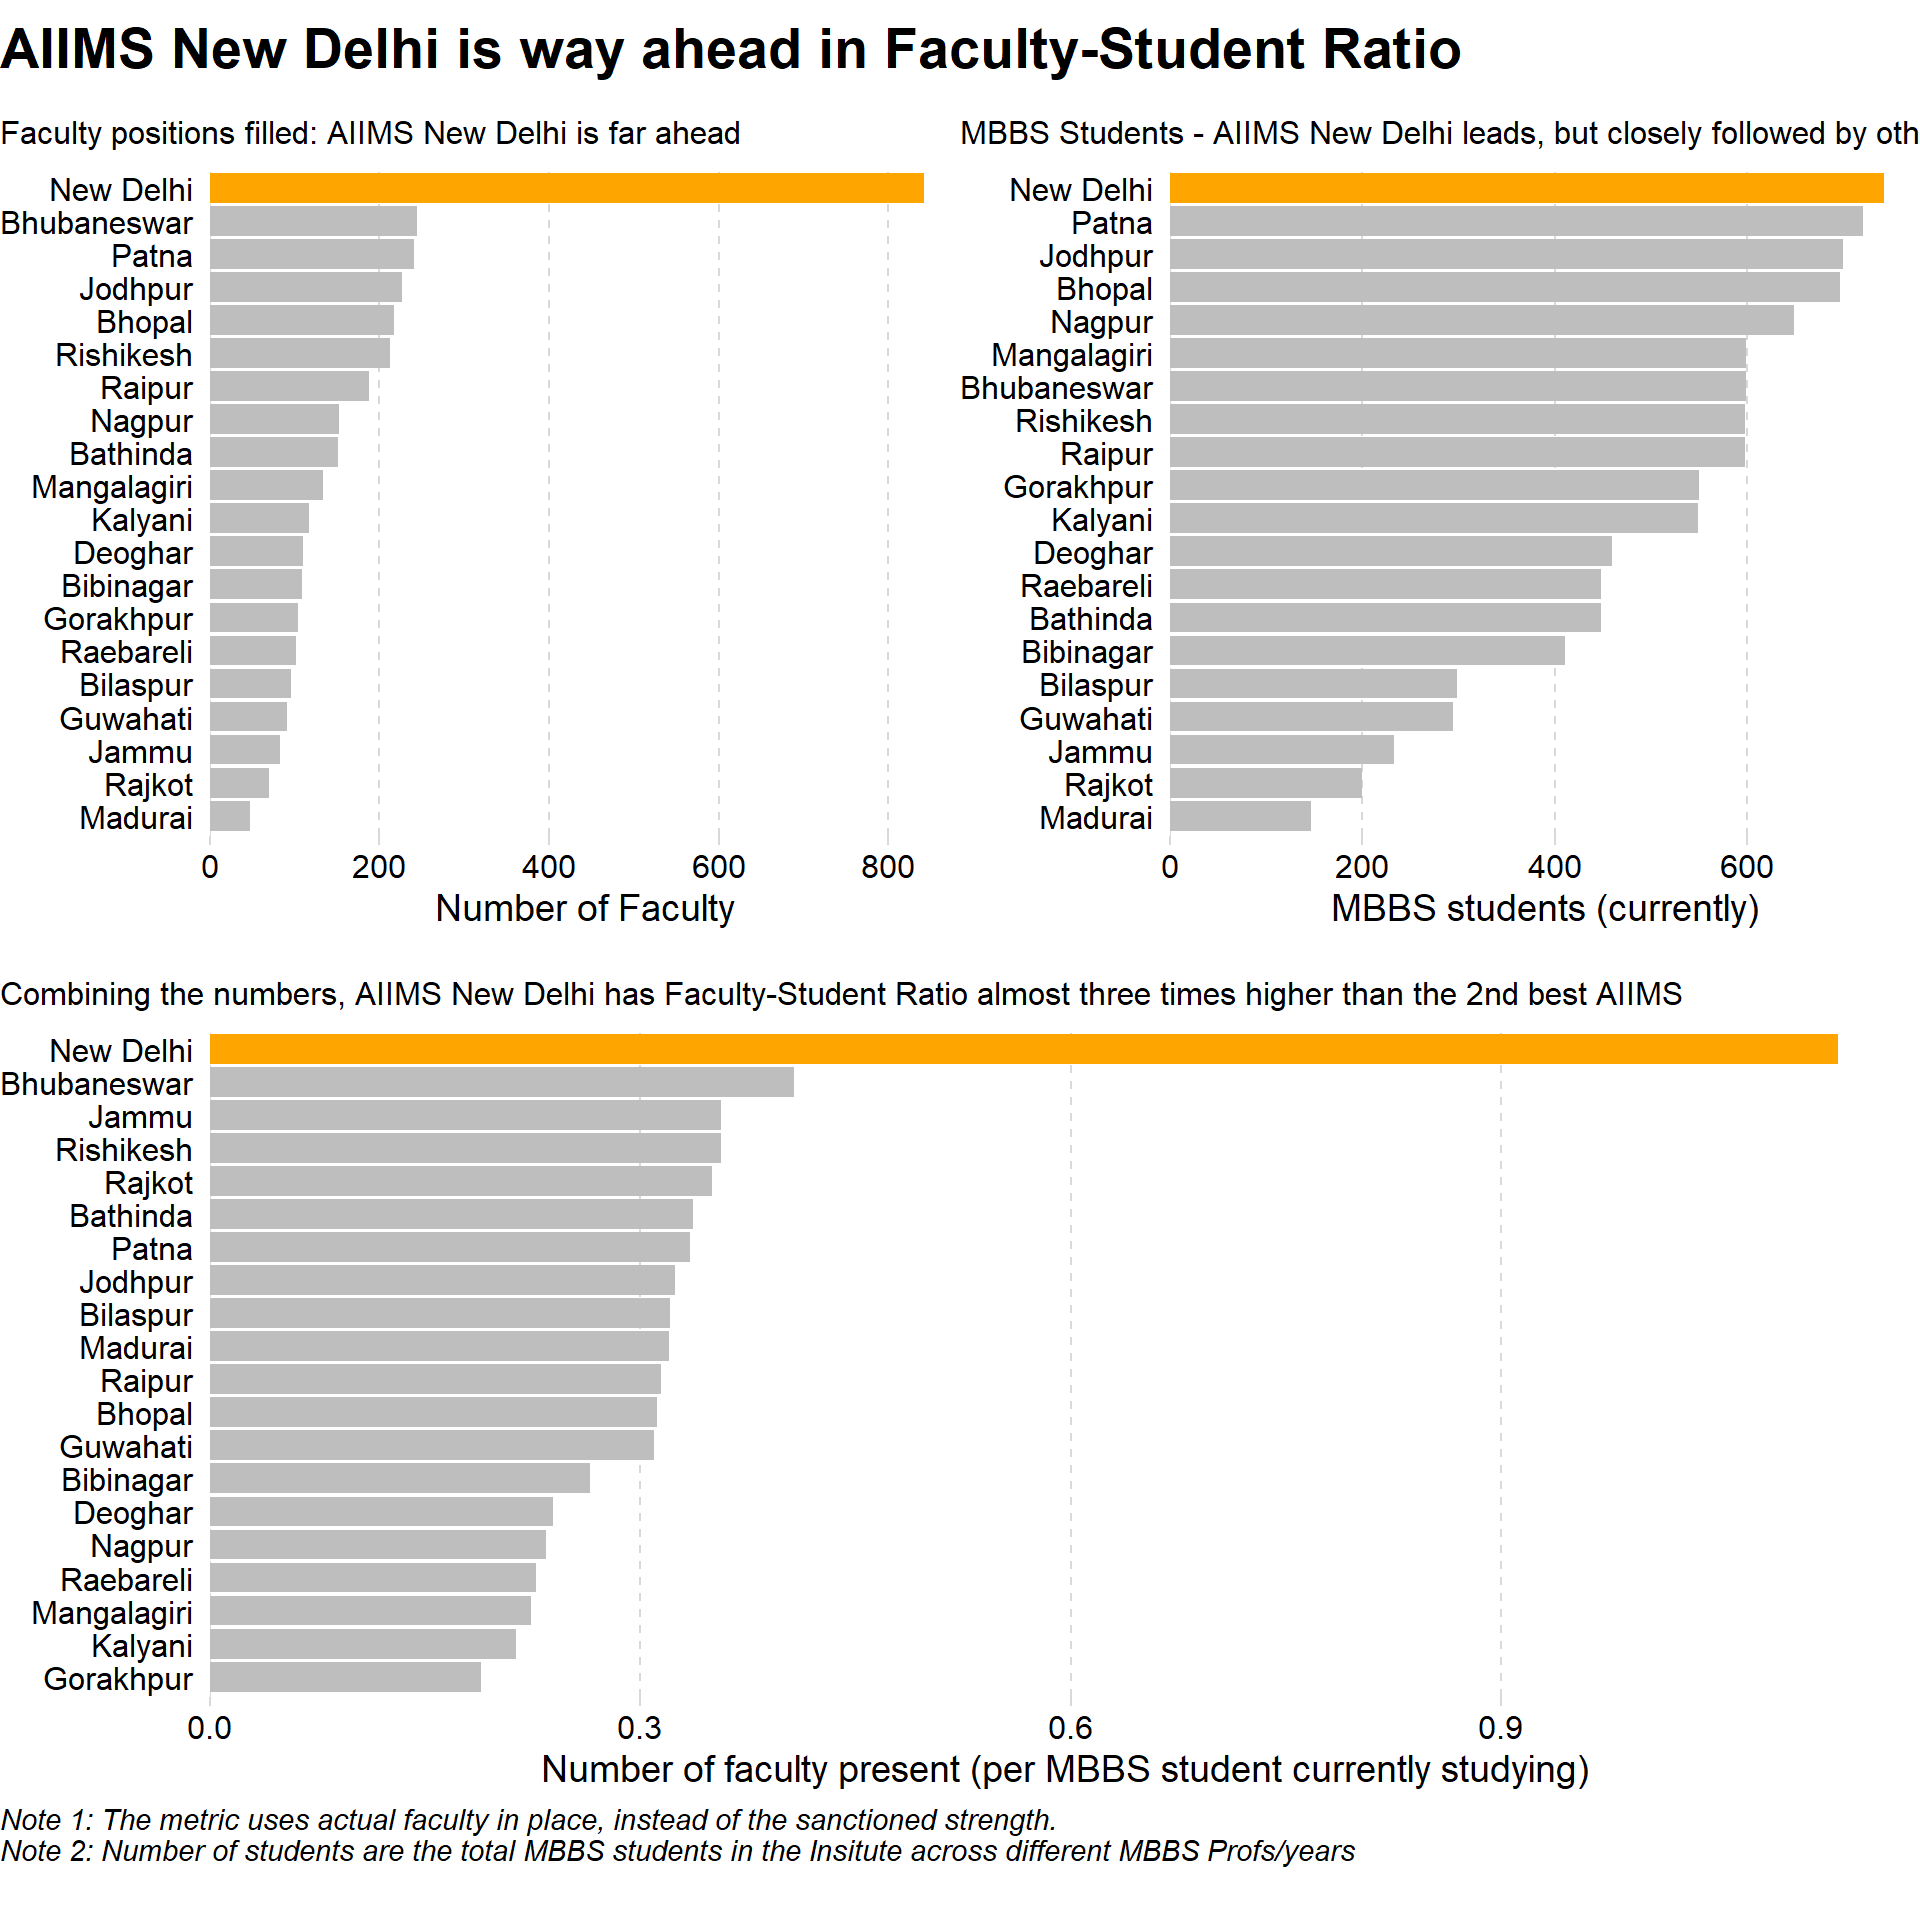
Unveiling the canvas of progress, our graphical odyssey unveils the quantum of faculty, students, and funding across India’s new upcoming AIIMS establishments. Amidst the evolving landscape, AIIMS New Delhi still stands as a benchmark of distinction, casting a guiding light for its peers as they carve their unique paths towards academic brilliance and healthcare innovation.

analysis
Government
Author

Aditya Dahiya

Published

December 10, 2023

Here, we look at some intersting statistics provided in reply to a question in Rajya Sabha (India’s Council of States, Upper House of the Parliament) Question 273, of the ongoing (December 2023) session. The question, and its answer, compares the 23 different All India Institute(s) of Medical Sciences (AIIMS), that have come up across India, and their comparison with the original AIIMS (New Delhi). The original question can be viewed here. The complete answer (in PDF) can be seen here.

[Note: All of the statistics come from official Rajya Sabha Website]
State/UT without AIIMS State with AIIMS OPD Patient visits (since May 2019) (in millions) 0 2M 4M 6M Hover / Touch the location to view OPD, IPD, Faculty and Student numbers All India Institute(s) of Medical Sciences
Figure 1: Interactive Map of India, with locations of various AIIMS Institutes

Figure 2: Exploring Faculty and student numbers in different AIIMS (as of Dec 2023)

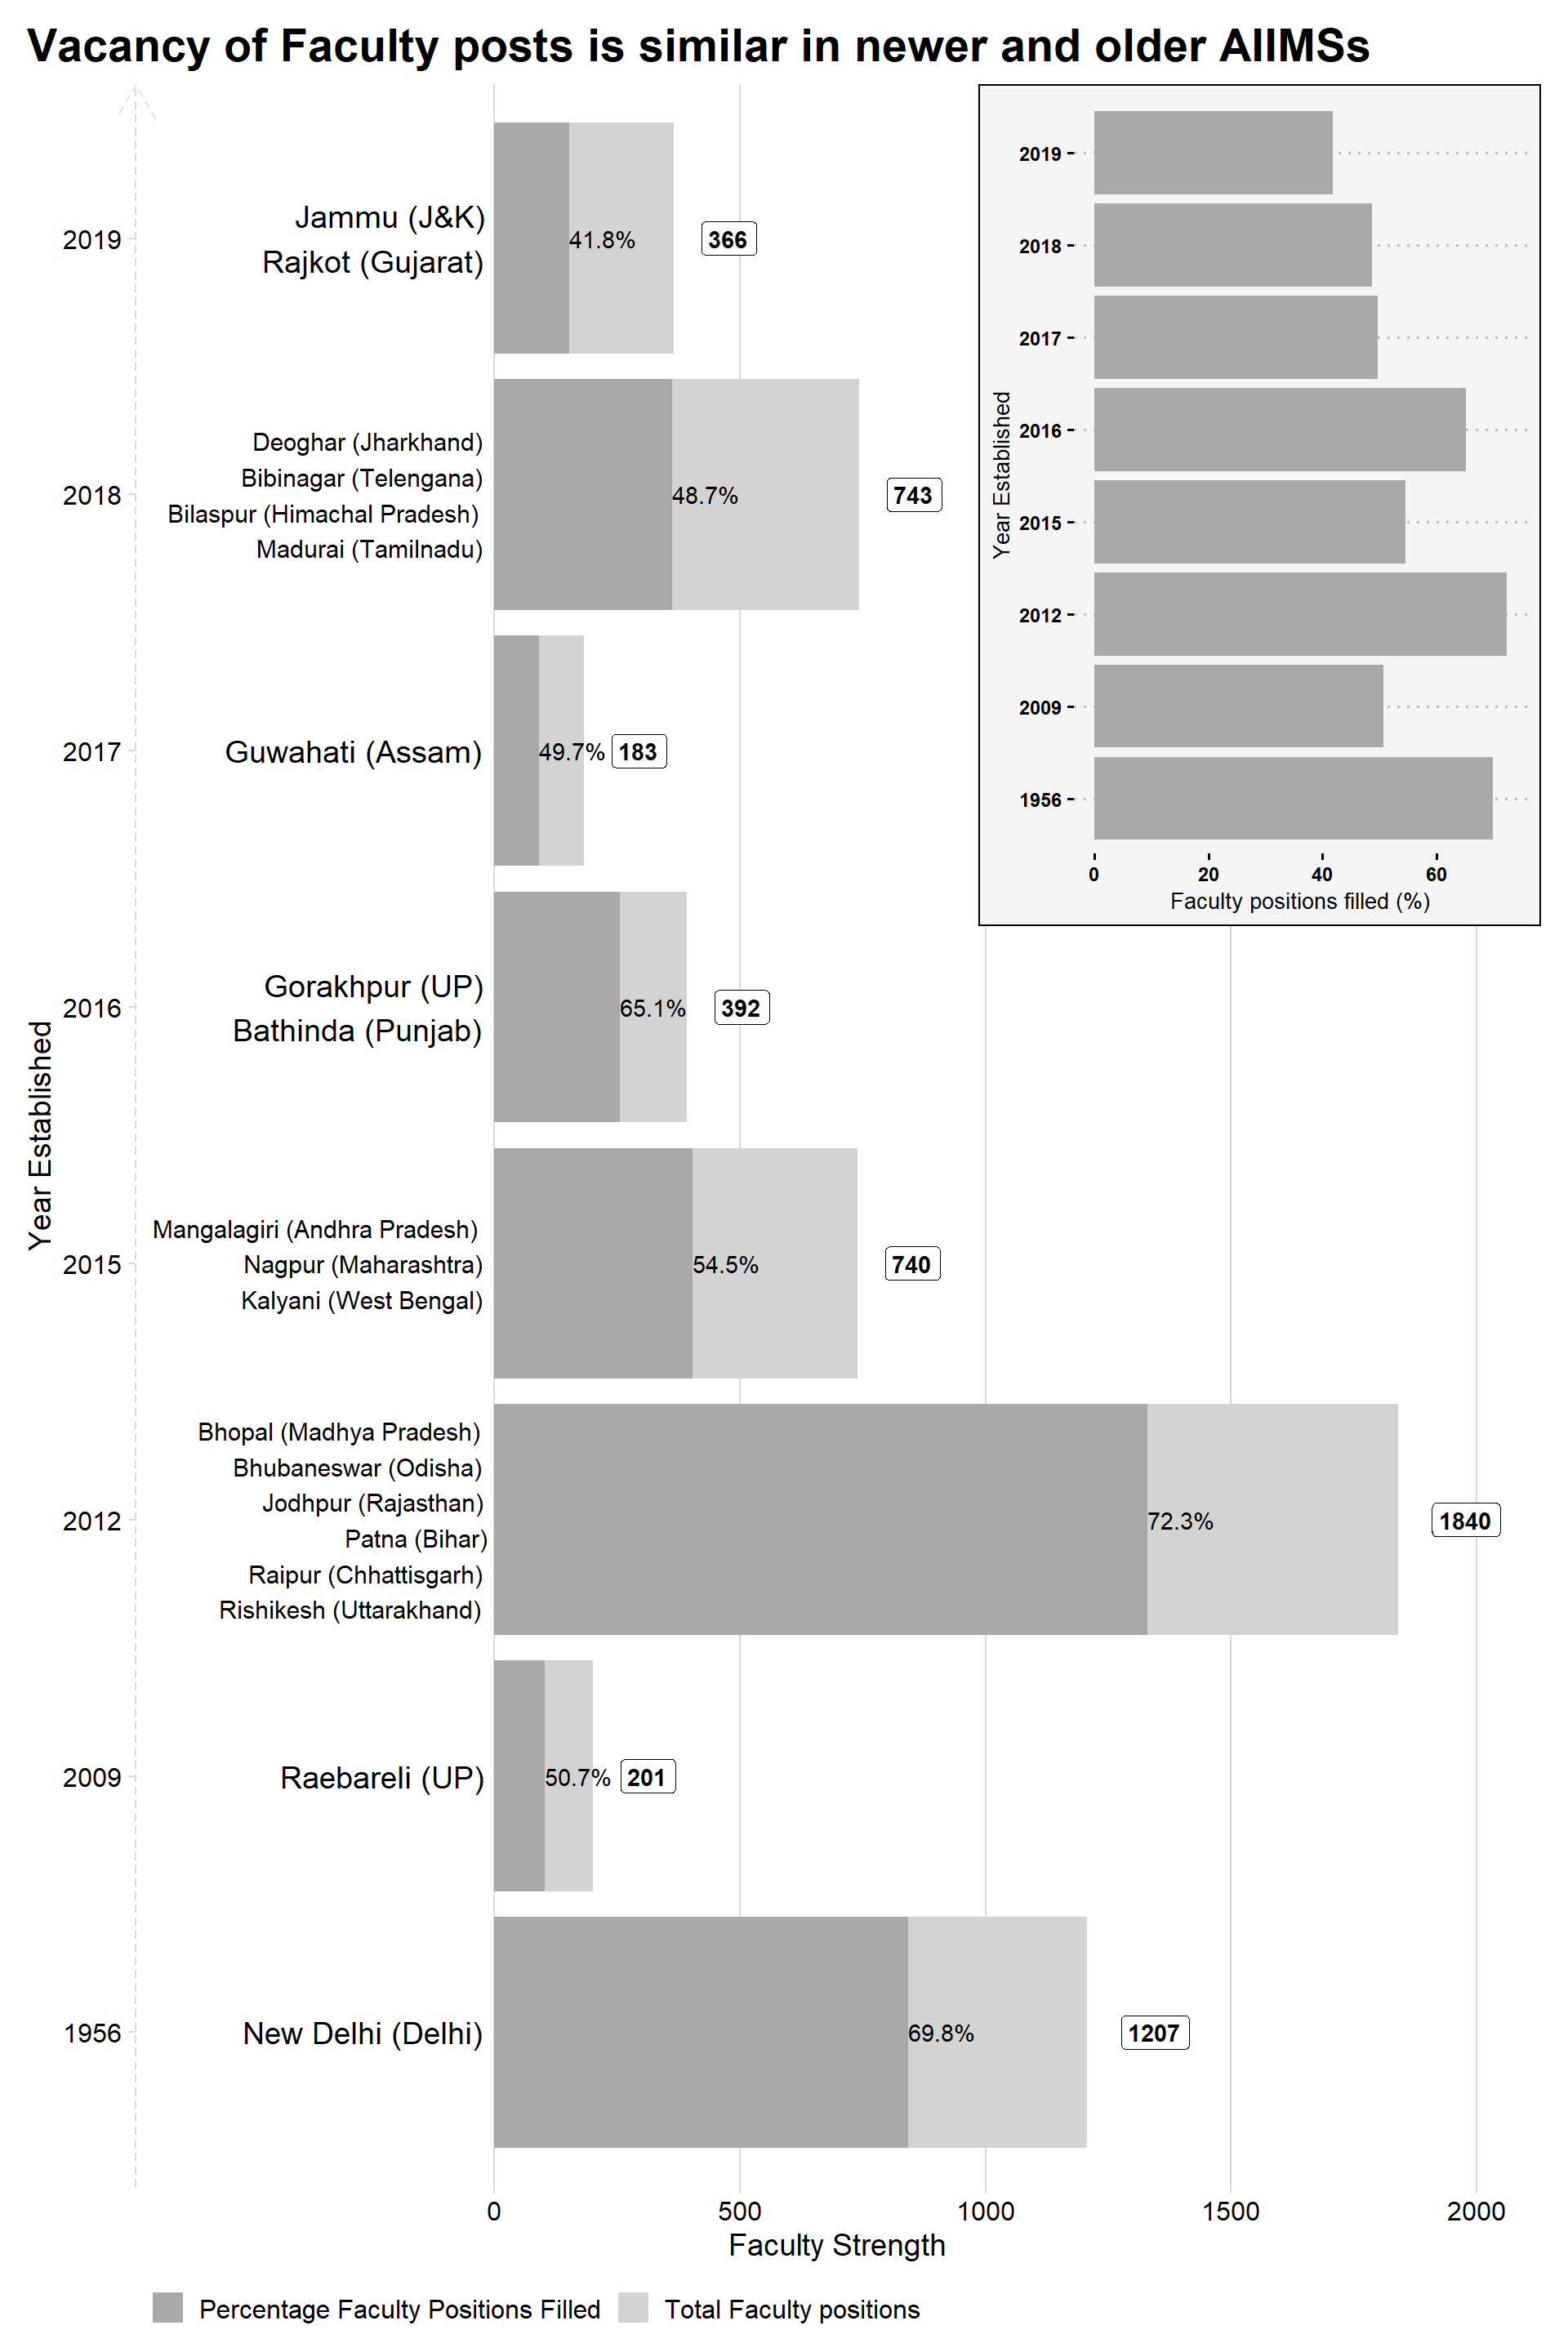
Figure 3: Percentage Faculty positions filled and vacant across different AIIMS

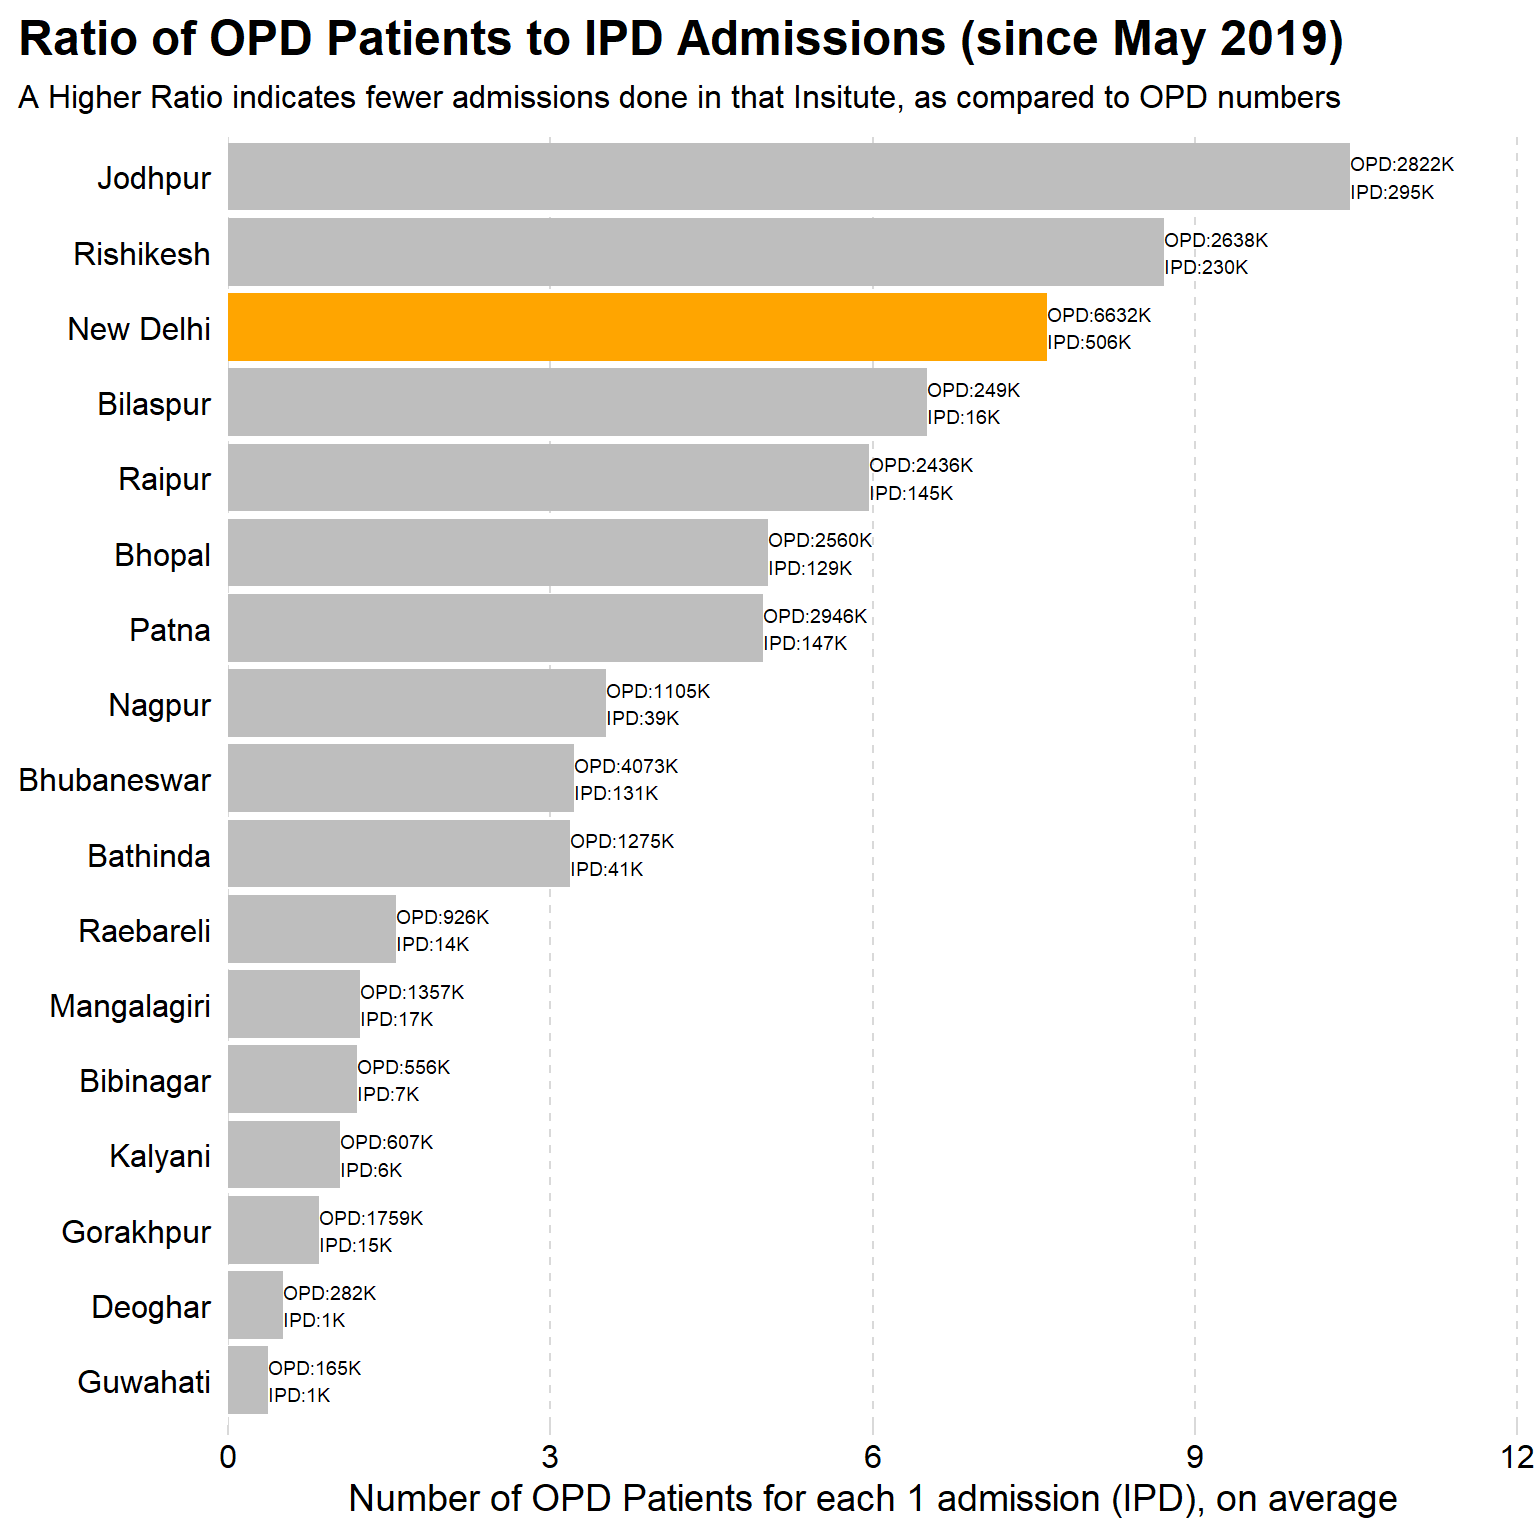
Figure 4: Comparing OPD and IPD (Admissions) numbers within each AIIMS

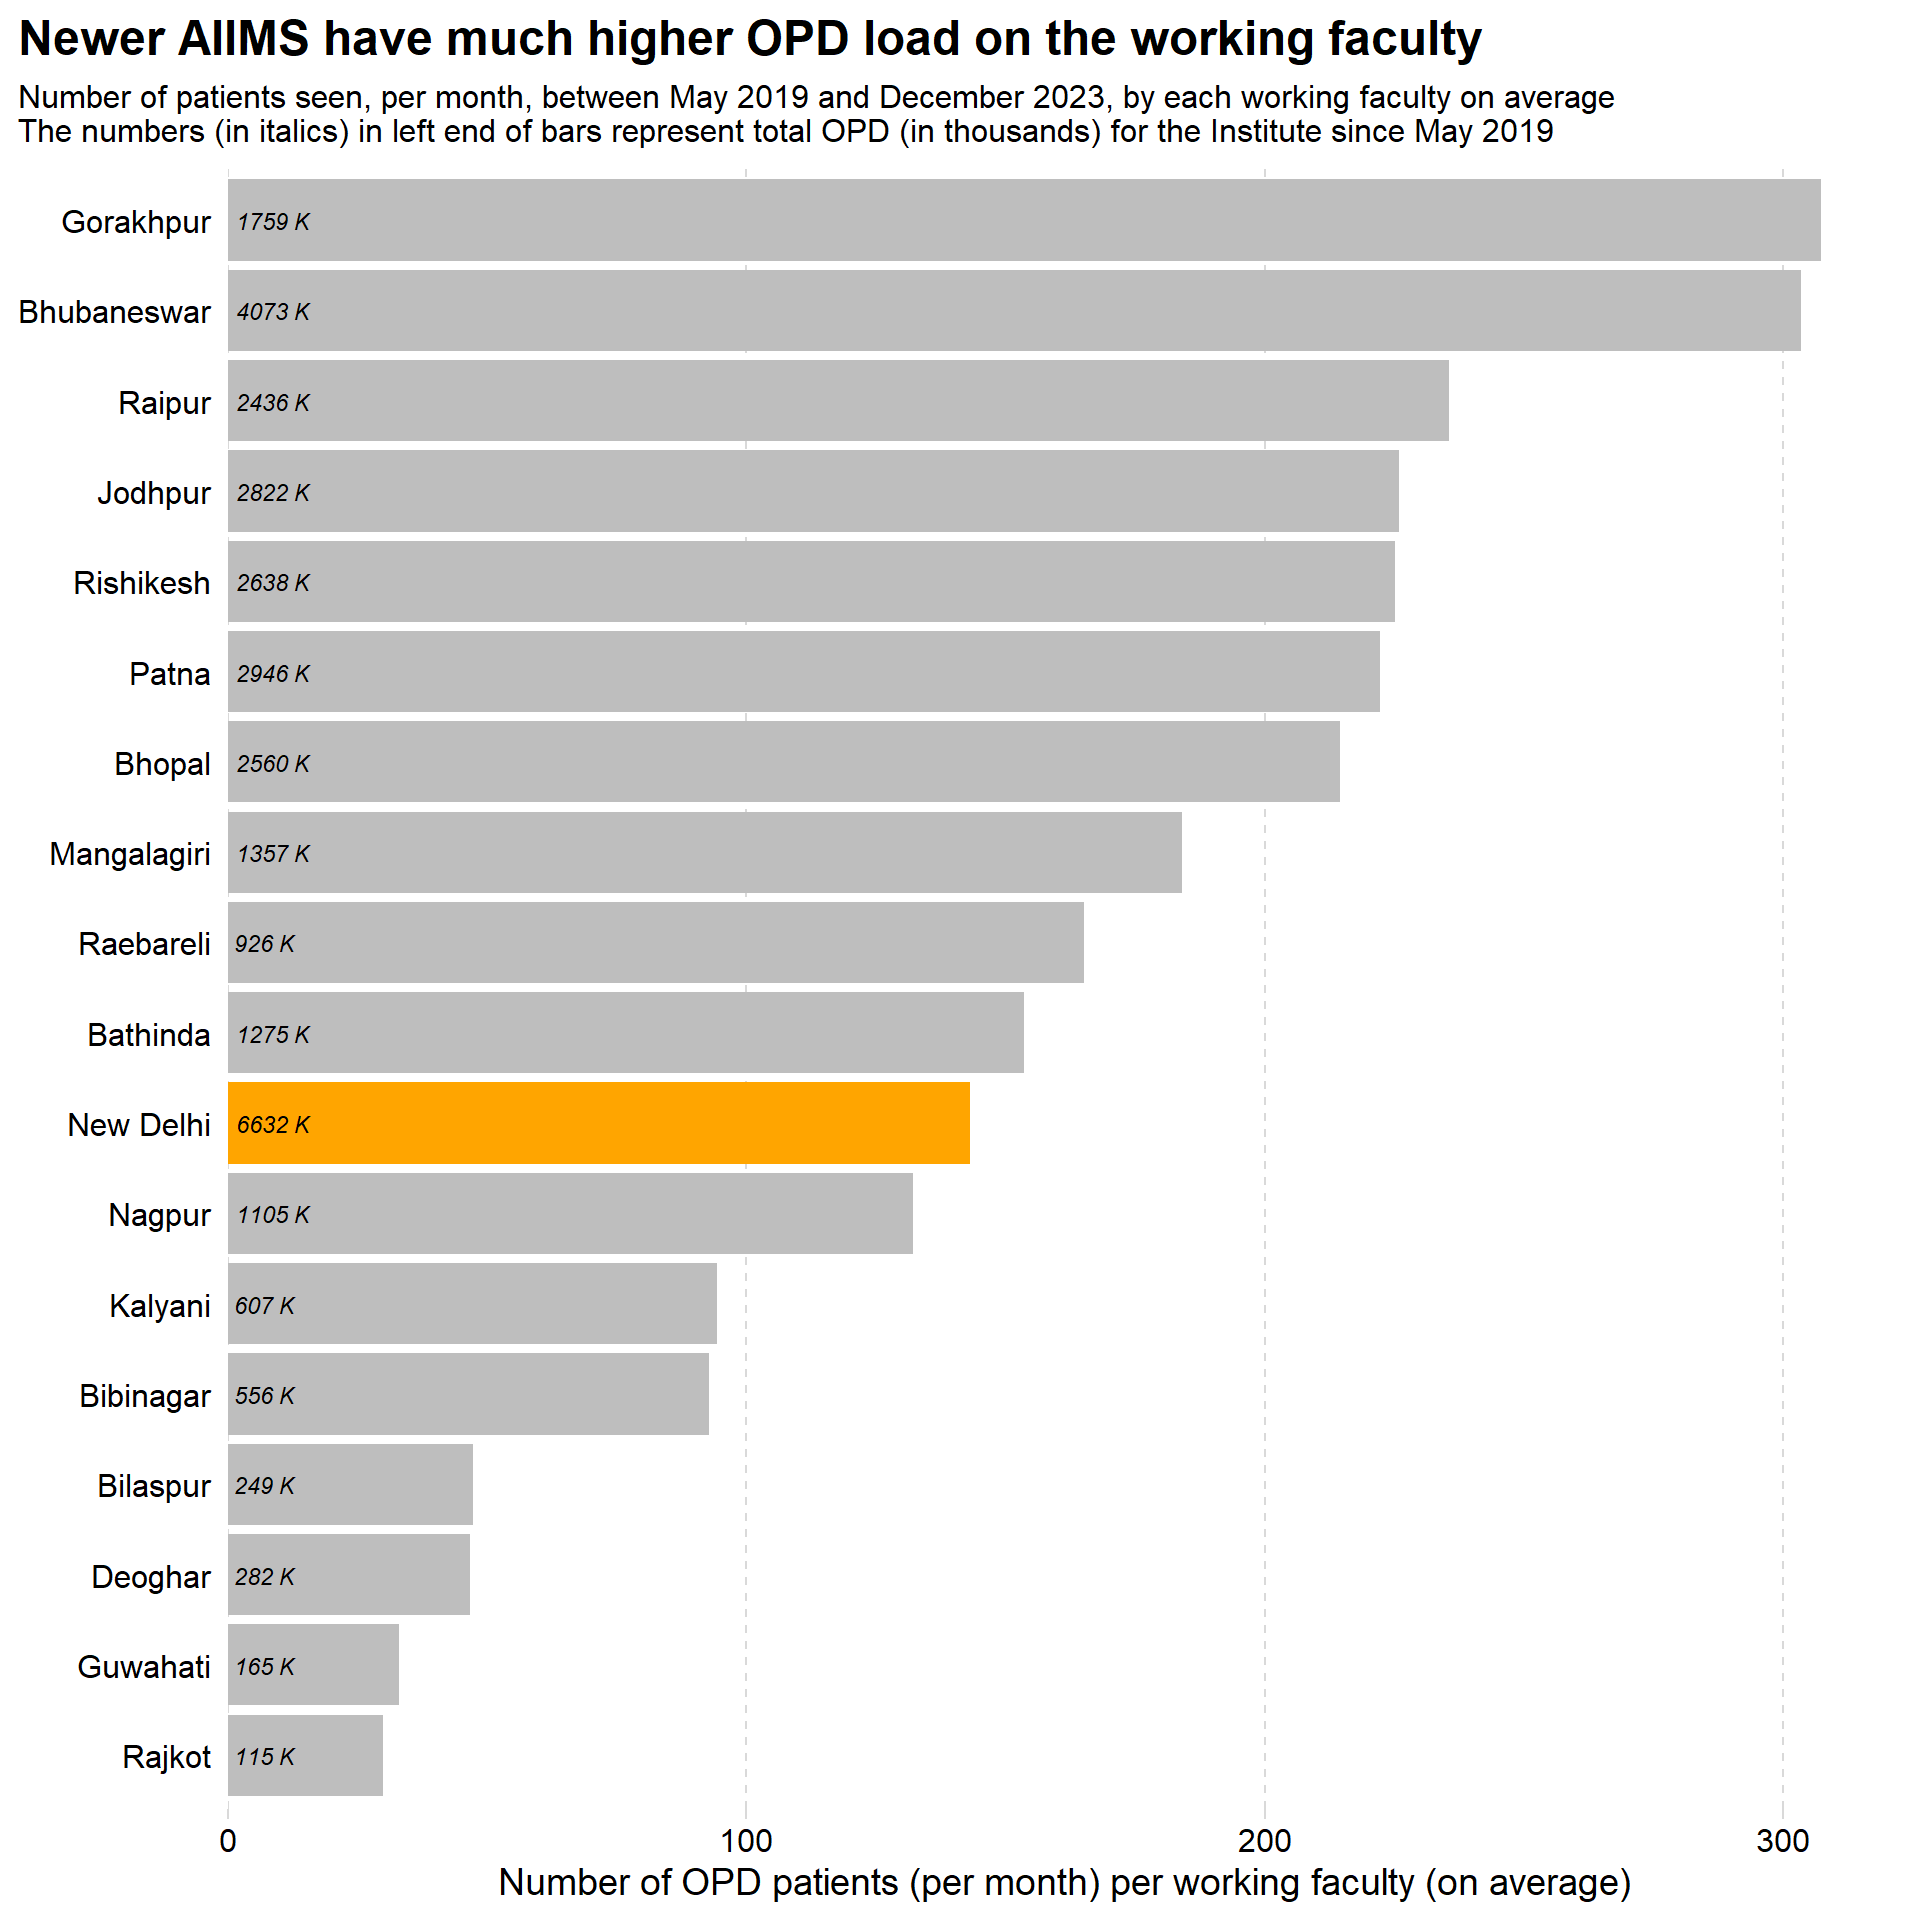
Figure 5: Ratio of OPD patients per month to the existing faculty at each AIIMS

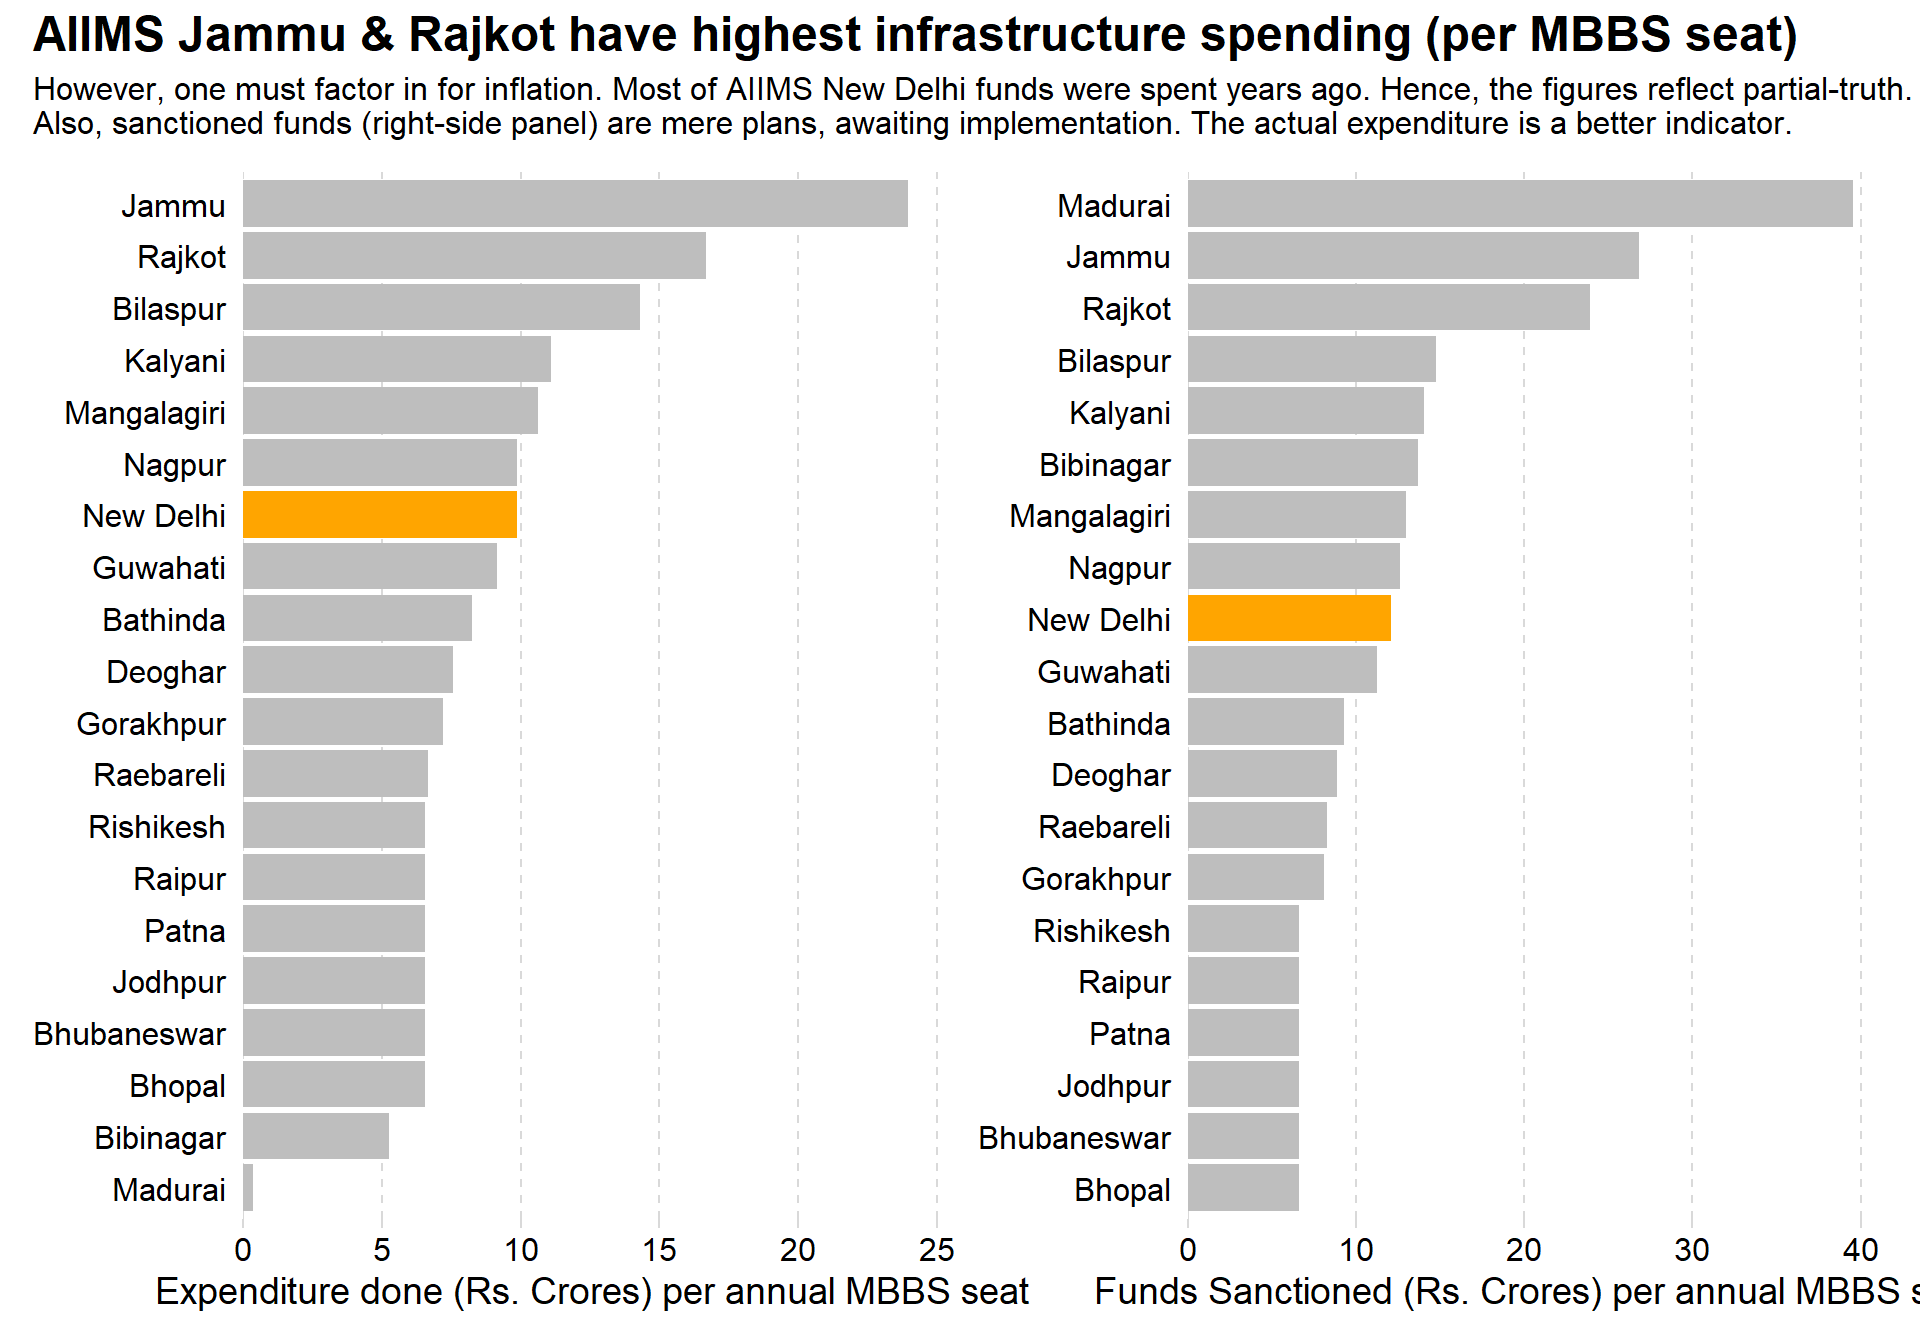
Figure 6: Spending, per MBBS seat: Sanctioned and Actual, for different AIIMS

The Complete Data (from Rajya Sabha reply)

Location
Year (Sanctioned)
Faculty (Sanctioned)
Faculty (in Position)
MBBS Sanctioned Seats
MBBS Students (currently)
Approved Project cost (in Rs. Crore)
Funds released/utilized (in Rs. Crore)
OPD patients (since May, 2019)
IPD patients (since May, 2019)
New Delhi
1956
1207
842
132
742
1,593
1,302
6,631,623
505,602
Bhopal
2012
305
217
125
697
820
820
2,560,247
128,739
Bhubaneswar
2012
315
244
125
599
820
820
4,073,069
131,116
Jodhpur
2012
305
227
125
700
820
820
2,822,047
294,712
Patna
2012
305
241
125
720
820
820
2,946,136
146,580
Raipur
2012
305
188
125
598
820
820
2,435,708
145,206
Rishikesh
2012
305
213
125
598
820
820
2,638,080
229,814
Raebareli
2009
201
102
100
448
823
665
926,496
14,494
Mangalagiri
2015
183
134
125
599
1,618
1,327
1,356,704
16,665
Nagpur
2015
298
152
125
649
1,577
1,235
1,104,851
38,888
1–10 of 23 rows