library(tidyverse)
library(nycflights13)
data("flights")
library(gt)Chapter 13
Logical Vectors
Some important take-away points
Use
near()instead of==when comparing numbers to ignore very small differences due to the way computers store numbers.Since,
NA != NA, we have to use another function to findNAsin the data, i.e.,is.na(). For example,filter(flights,dep_time == NA)will not yield any row. Instead, we should usefilter(flights, is.na(dep_time)).To shown missing values first, we will have to use
arrange(<DF>, desc(is.na(<Var_Name>)), <Var_Name>)
13.2.4 Exercises
Question 1
How does dplyr::near() work? Type near to see the source code. Is sqrt(2)^2 near 2?
dplyr::near() is used for testing whether two numeric values are close to each other within a certain tolerance. This is useful when working with floating-point numbers, where exact equality can be problematic due to precision limitations. It takes three arguments:
x: The first numeric value to compare.y: The second numeric value to compare.tol: Tolerance level, which is a small positive numeric value that defines how closexandyneed to be to be considered “near.” By default, it uses.Machine$double.eps^0.5, which is a good default for most cases.
Note 1: The variable .Machine contains data concerning the numerical attributes of the computer system where R is currently operating. This information encompasses details like the maximum values for double, and integer types, as well as the machine’s precision.
Note 2: The double.eps value represents the smallest positive floating-point number x for which the equation 1 + x != 1 holds true. Its calculation involves the base of the double data type and the number of significant digits (ulp.digits). Specifically, if the base is 2 or the rounding method is 0, it equals double.base ^ ulp.digits. In other cases, it is (double.base ^ double.ulp.digits) / 2. Typically, this value is approximately 2.220446e-16.
near
## function (x, y, tol = .Machine$double.eps^0.5)
## {
##     abs(x - y) < tol
## }
## <bytecode: 0x000001b2a68444a8>
## <environment: namespace:dplyr>
.Machine$double.eps
## [1] 2.220446e-16
.Machine$double.eps^0.5
## [1] 1.490116e-08
Thus, dplyr::near() works by checking whether the absolute value of the difference between x and y is less that the square-root of .Machine$double.eps or not.
As shown in the code below, yes, sqrt(2)^2 is near 2.
near(sqrt(2)^2, 2)
## [1] TRUE
Question 2
Use mutate(), is.na(), and count() together to describe how the missing values in dep_time, sched_dep_time and dep_delay are connected.
First, let us try to compute the number of rows where, as it should be, sched_dep_time - dep_time == dep_delay. As we see below, the results is NA since NAs are contagious in addition, the result returns NA .
flights |>
  select(dep_time, sched_dep_time, dep_delay) |>
  mutate(check1 = sched_dep_time - dep_time == dep_delay) |>
  summarise(
    n = n(),
    equal = sum(check1)
  )
# A tibble: 1 × 2
n equal
<int> <int>
1 336776 NANow, let us rework the maths with using is.na() to remove missing values of departure time, i.e. cancelled flights. We can use filter(!is.na(dep_time)) . The results indicate that 69.% of flights, the departure delay is equal to difference between departure time and scheduled departure time.
flights |>
  select(dep_time, sched_dep_time, dep_delay) |>
  filter(!is.na(dep_time)) |>
  mutate(check1 = dep_time - sched_dep_time == dep_delay) |>
  summarise(
    total = n(),
    equal = sum(check1)
  ) |>
  mutate(perc_equal = (equal*100)/total)
# A tibble: 1 × 3
total equal perc_equal
<int> <int> <dbl>
1 328521 228744 69.6Now, onto checking the relation between missing values. We observe that none of the Scheduled Departure Time values are missing. There are 8,255 missing Departure Time values, which indicate a cancelled flight. There are also 8,255 missing Departure Delay values, and we show below that these are the exact same flights for which the departure time is missing. Thus, the missing values in dep_delay and dep_time are connected and exaclty occurring for same rows.
# Number of row with missing Scheduled Departure Time
flights |>
  filter(is.na(sched_dep_time)) |>
  count() |>
  as.numeric()
[1] 0# The number of rows with missing Departure Time
flights |>
filter(is.na(dep_time)) |>
count() |>
as.numeric()[1] 8255# The number of rows with missing Departure Delay
flights |>
filter(is.na(dep_delay)) |>
count() |>
as.numeric()[1] 8255# Checking whether the exact same rows have missing values
# for Departure Time and Departure Delay
sum(which(is.na(flights$dep_time)) != which(is.na(flights$dep_delay)))[1] 013.3.4 Exercises
Question 1
Find all flights where arr_delay is missing but dep_delay is not. Find all flights where neither arr_time nor sched_arr_time are missing, but arr_delay is.
The following code displays all flights where arr_delay is missing but dep_delay is not in Figure 1. There are 1,175 such flights.
flights |>
  filter(is.na(arr_delay) & !is.na(dep_delay)) |>
  select(flight, arr_delay, dep_delay) |>
  gt() |>
  cols_label(flight = "Flight Number",
             arr_delay = "Arrival Delay (in min)",
             dep_delay = "Departure Delay (in min)") |>
opt_interactive(pagination_type = "jump")The following code displays all flights where neither arr_time nor sched_arr_time are missing, but arr_delay is missing reflected in Figure 2. There are 717 such flights.
flights |>
  filter(!is.na(arr_time) & !is.na(sched_arr_time) & is.na(arr_delay)) |>
  select(flight, arr_time, sched_arr_time, arr_delay) |>
  gt() |>
  cols_label(flight = "Flight Number",
             arr_delay = "Arrival Delay (in min)",
             arr_time = "Arrival Time (hrs)",
             sched_arr_time = "Scheduled Arrival Time (hrs)") |>
opt_interactive(pagination_type = "jump")Question 2
How many flights have a missing dep_time? What other variables are missing in these rows? What might these rows represent?
The following code shows us that 8,255 flights have a missing dep_time . Further, Figure 3 shows us that these flights have missing dep_delay , arr_time , arr_delay and air_time. Further, around 30% of these have missing tailnum.
Thus, these rows most likely represent cancelled flights.
flights |>
  filter(is.na(dep_time)) |>
  count() |> as.numeric()
[1] 8255flights |>
filter(is.na(dep_time)) |>
naniar::vis_miss() +
theme(axis.title.y = element_blank(),
axis.text.y = element_blank(),
axis.ticks.y = element_blank(),
axis.text.x.top = element_text(angle = 90))
Question 3
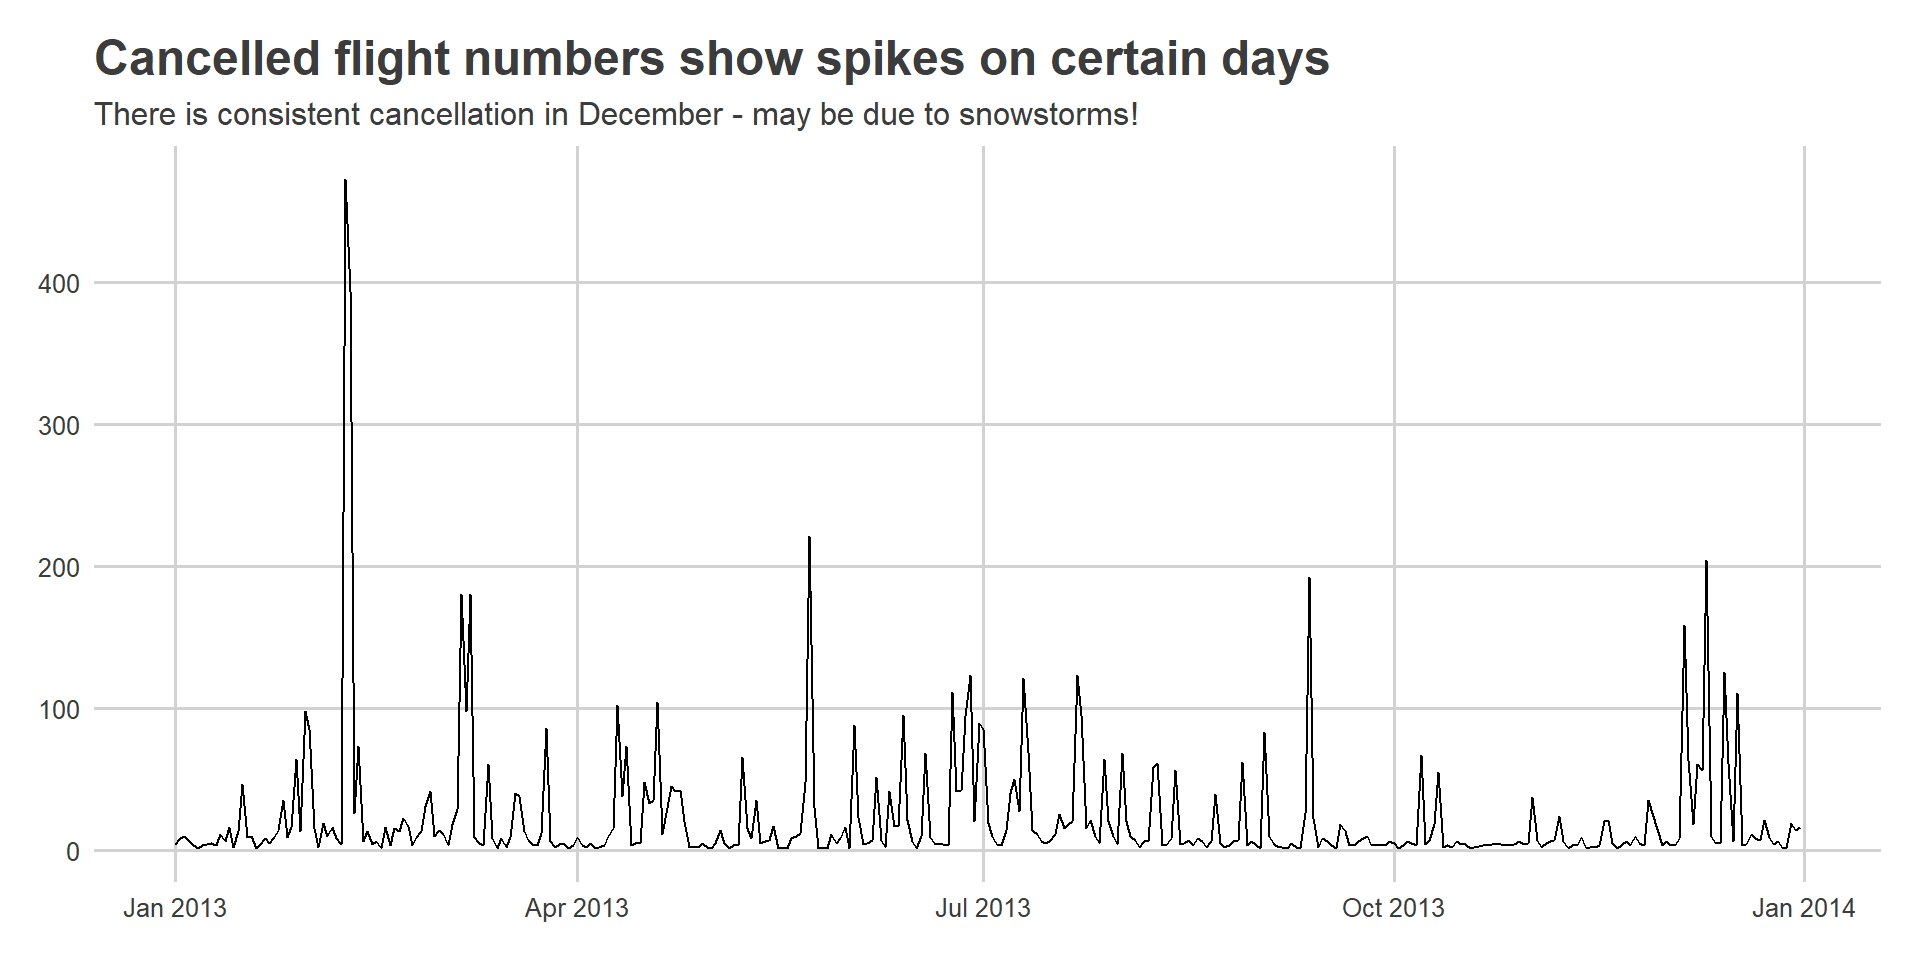
Assuming that a missing dep_time implies that a flight is cancelled, look at the number of cancelled flights per day. Is there a pattern? Is there a connection between the proportion of cancelled flights and the average delay of non-cancelled flights?
As shown in Figure 4 below, when seen over the entire course of year, no specific pattern emerges. However, certain months show more number of spikes - there is one day with large number of cancellations (over 400) in February. When seen month-wise, as in Figure 5 , it becomes apparent that most flight cancellations occur in December - March; or in June-July.
Code
flights |>
  filter(is.na(dep_time)) |>
  mutate(date = make_date(year = year,
                          month = month,
                          day = day)) |>
  group_by(date) |>
  count() |>
  ggplot(aes(x = date, y = n)) +
  geom_line() +
  ggthemes::theme_fivethirtyeight() +
  labs(title = "Cancelled flight numbers show spikes on certain days",
       subtitle = "There is consistent cancellation in December - may be due to snowstorms!") +
  theme(
    plot.background = element_rect(fill = "white"),
    panel.background = element_rect(fill = "white", colour = "white")
    )
Code
mths_lab = c("Jan", "Feb", "Mar", "Apr",
             "May", "Jun", "Jul", "Aug",
             "Sep", "Oct", "Nov", "Dec")
gridExtra::grid.arrange(
  flights |>
    filter(is.na(dep_time)) |>
    group_by(month) |>
    count() |>
    ggplot(aes(x = month, y = n)) +
    geom_line() +
    ggthemes::theme_fivethirtyeight() +
    labs(y = "No. of cancelled flights",
         title = "Flight cancellations occur most \nin a few months",
         subtitle = "December-Feruary, June-July see maximum cancelled flights. \nOctober-November have the least cancellations") +
    scale_x_continuous(breaks = 1:12,
                       labels = mths_lab) +
    theme(title = element_text(size = 8)) +
    theme(
      plot.background = element_rect(fill = "white"),
      panel.background = element_rect(fill = "white", colour = "white")
    ),

  flights |>
    filter(is.na(dep_time)) |>
    group_by(day) |>
    count() |>
    ggplot(aes(x = day, y = n)) +
    geom_line() +
    geom_point(col = "darkgrey", size = 2) +
    ggthemes::theme_fivethirtyeight() +
    labs(y = "No. of cancelled flights",
         title = "Flight cancellations spike on 8th-9th days \nof the months",
         subtitle = "This is unlikely to be a pattern since \nthis is a sum, influenced by a few high values") +
    scale_x_continuous(breaks = seq(1, 31, 5)) +
    theme(title = element_text(size = 8)) +
    theme(
      plot.background = element_rect(fill = "white"),
      panel.background = element_rect(fill = "white", colour = "white")
    ),

ncol = 2)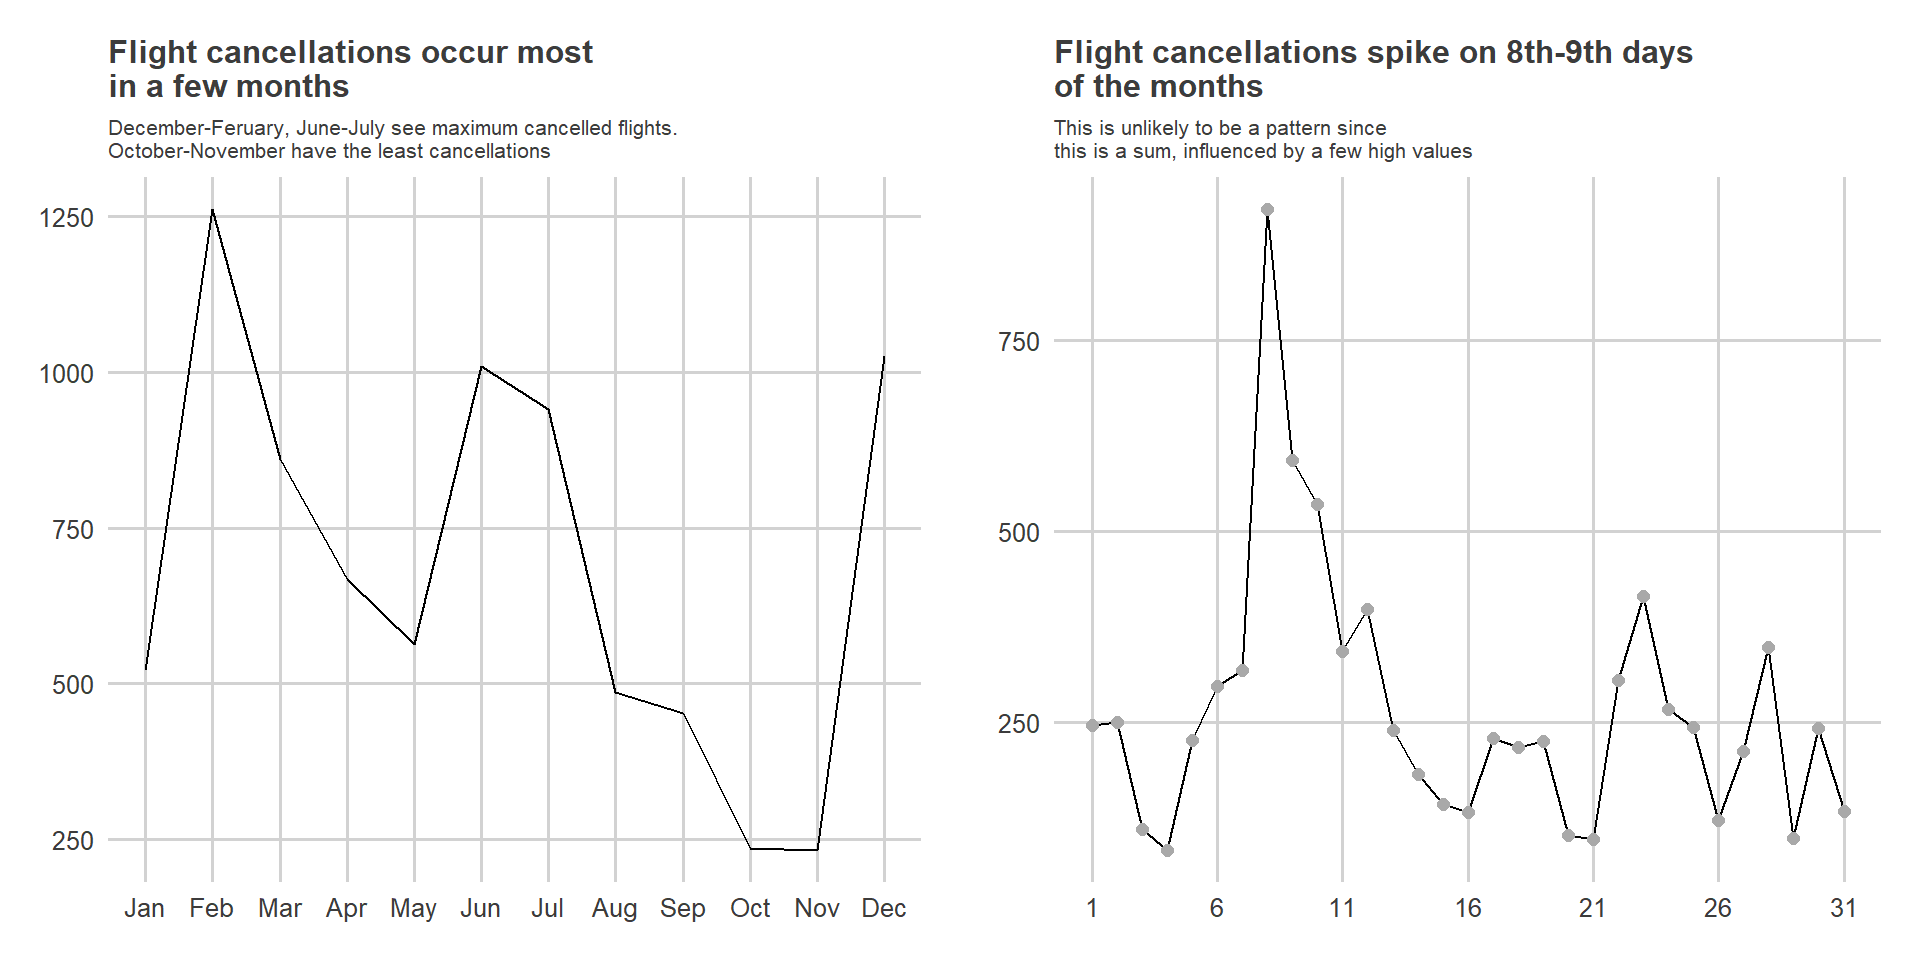
The following Figure 6 depicts the connection between the proportion of cancelled flights and the average delay of non-cancelled flights. It shows that there is high average delay on the days where there are more cancelled flights, perhaps because bad weather causes both.
Note: Here, I used geom_smooth() instead of geom_line() to make the pattern more easily perceptible.
Code
coeff = 0.15

flights |>
  mutate(date = make_date(year = year,
                          month = month,
                          day = day)) |>
  group_by(month, date) |>
  summarise(
    n = n(),
    cancelled = sum(is.na(dep_time)),
    prop_cancelled = sum(is.na(dep_time)) / n(),
    avg_delay = mean(dep_delay, na.rm = TRUE)
  ) |>
  ggplot(aes(x = date)) +
  geom_smooth(aes(y = prop_cancelled * 100),
              method = "loess",
              span = coeff,
              col = "red",
              se = FALSE) +
  geom_smooth(aes(y = avg_delay), ,
              method = "loess",
              span = coeff,
              col = "blue",
              se = FALSE) +
  theme_minimal() +
  scale_y_continuous(
    name = "Percentage Cancelled Flights (%)",
    sec.axis = sec_axis(trans = ~ .*0.5,
                        name = "Avg. Delay (min.)")) +
  labs(x = NULL) +
  theme(axis.text.y.left = element_text(color = "red"),
        axis.title.y.left = element_text(color = "red"),
        axis.text.y.right = element_text(color = "blue"),
        axis.title.y.right = element_text(color = "blue")) +
  labs(title = "Flight Cancellations and average delays are correlated",
       subtitle = "Higher average delay occurs on same days as more flight cancellations")
13.4.4 Exercises
Question 1
What will sum(is.na(x)) tell you? How about mean(is.na(x))?
The expression sum(is.na(x)) tells us the number of missing values in the vector x. The expression mean(is.na(x)) tells us the proportion of missing values in the vector x .
This is because is.na(x) is a function or operation used to determine which elements of a vector or data structure x are missing or NA (Not Available) values. NA values typically represent missing or undefined data points. Here’s what the two expressions you provided mean:
sum(is.na(x)):This expression will count the number of NA (missing) values in the vector or data structure
x. It calculates the total count of NA values in the entire dataset.The result will be an integer representing the count of NA values.
mean(is.na(x)):This expression will calculate the proportion of NA (missing) values in the vector or data structure
x. It calculates the average of a binary vector where each element is either 1 (if NA) or 0 (if not NA).The result will be a numeric value between 0 and 1, representing the fraction of missing values in the dataset. It can be interpreted as the percentage of missing values when multiplied by 100.
Here’s a simple example in R to illustrate these concepts:
# Sample vector with missing values
x <- c(1, NA, 3, NA, 5, 6)

# Count of missing values
count_missing <- sum(is.na(x))
cat("Count of missing values:", count_missing, "\n")
Count of missing values: 2 # Proportion of missing values
prop_missing <- mean(is.na(x))
cat("Proportion of missing values:", prop_missing, "\n")Proportion of missing values: 0.3333333 Question 2
What does prod() return when applied to a logical vector? What logical summary function is it equivalent to? What does min() return when applied to a logical vector? What logical summary function is it equivalent to? Read the documentation and perform a few experiments.
# A logical vector with random TRUE and FALSE
random <- sample(c(TRUE, FALSE),
            size = 10,
            replace = TRUE)
random
##  [1]  TRUE  TRUE  TRUE FALSE FALSE  TRUE  TRUE  TRUE FALSE  TRUE
# A logical vector with all TRUE
all_true <- rep(TRUE, 10)
all_true
##  [1] TRUE TRUE TRUE TRUE TRUE TRUE TRUE TRUE TRUE TRUE
# A logical vector with all FALSE
all_false <- rep(FALSE, 10)
all_false
##  [1] FALSE FALSE FALSE FALSE FALSE FALSE FALSE FALSE FALSE FALSE

prod(random)
## [1] 0
prod(all_true)
## [1] 1
prod(all_false)
## [1] 0

min(random)
## [1] 0
min(all_true)
## [1] 1
min(all_false)
## [1] 0
In R, when we apply the prod() function to a logical vector, it treats TRUE as 1 and FALSE as 0, and then computes the product of the elements in the vector. Essentially, it multiplies all the elements together. This can be useful when we want to check if all elements in a logical vector are TRUE, as the product will be 1 if all are TRUE and 0 if any of them is FALSE.
This is equivalent to using the all() function, which checks if all elements in a logical vector are TRUE. The all() function returns TRUE if all elements are TRUE and FALSE otherwise.
Now, when we apply the min() function to a logical vector, it also treats TRUE as 1 and FALSE as 0, and then computes the minimum value. Since 0 represents FALSE and 1 represents TRUE, the minimum value in a logical vector is FALSE (0). Therefore, when we use min() on a logical vector with even one value FALSE, it will return FALSE.
In summary, prod() and min() applied to logical vectors have specific behavior related to the interpretation of TRUE and FALSE, and they are equivalent to the all().
Note: max() will act as equivalent to the any() function.
13.5.4 Exercises
Question 1
A number is even if it's divisible by two, which in R you can find out with x %% 2 == 0. Use this fact and if_else() to determine whether each number between 0 and 20 is even or odd.
The easiest way to do this would be if_else(x %% 2 == 0, true = "even", false = "odd"), as shown below: –
x = 0:20
if_else(x %% 2 == 0,
        true = "even",
        false = "odd")
[1] "even" "odd" "even" "odd" "even" "odd" "even" "odd" "even" "odd"
[11] "even" "odd" "even" "odd" "even" "odd" "even" "odd" "even" "odd"
[21] "even"Question 2
Given a vector of days like x <- c("Monday", "Saturday", "Wednesday"), use an ifelse() statement to label them as weekends or weekdays.
The code shown below does the job: –
days = c("Monday", "Tuesday", "Wednesday", "Thursday",
      "Friday", "Saturday", "Sunday")
weeknd = c("Saturday", "Sunday")

x = sample(days, size = 10, replace = TRUE)

cbind(x,
      if_else(x %in% weeknd,
              "Weekends",
              "Weekdays",
              "NA")) |>
as_tibble() |> gt()| x | V2 |
|---|---|
| Friday | Weekdays |
| Friday | Weekdays |
| Thursday | Weekdays |
| Friday | Weekdays |
| Saturday | Weekends |
| Thursday | Weekdays |
| Sunday | Weekends |
| Thursday | Weekdays |
| Wednesday | Weekdays |
| Sunday | Weekends |
Question 3
Use ifelse() to compute the absolute value of a numeric vector called x.
We can use the code if_else(x < 0, true = -x, false = x, missing = 0) to do so, as shown below: –
x = sample(x = -10:10,
           replace = TRUE,
           size = 100)

tibble(
  x = x,
  abs_x = if_else(x < 0,
                  true = -x,
                  false = x,
                  missing = 0)
) |>
  gt() |>
  opt_interactive(use_pagination = TRUE,
                  pagination_type = "simple")
Question 4
Write a case_when() statement that uses the month and day columns from flights to label a selection of important US holidays (e.g., New Years Day, 4th of July, Thanksgiving, and Christmas). First create a logical column that is either TRUE or FALSE, and then create a character column that either gives the name of the holiday or is NA.
Here is the code: –
flights |>
  mutate(holiday = case_when(
    month == 1 & day == 1   ~ "New Year’s Day",
    month == 6 & day == 19  ~ "Juneteenth National Independence Day",
    month == 7 & day == 4   ~ "Independence Day",
    month == 11 & day == 11 ~ "Veterans’ Day",
    month == 12 & day == 25 ~ "Christmas Day",
    .default = NA
  ),
  .keep = "used") |>
  mutate(is_holiday = if_else(!is.na(holiday),
                              true = TRUE,
                              false = FALSE))
# A tibble: 336,776 × 4
month day holiday is_holiday
<int> <int> <chr> <lgl>
1 1 1 New Year’s Day TRUE
2 1 1 New Year’s Day TRUE
3 1 1 New Year’s Day TRUE
4 1 1 New Year’s Day TRUE
5 1 1 New Year’s Day TRUE
6 1 1 New Year’s Day TRUE
7 1 1 New Year’s Day TRUE
8 1 1 New Year’s Day TRUE
9 1 1 New Year’s Day TRUE
10 1 1 New Year’s Day TRUE
# ℹ 336,766 more rowsAnother way to code this creating the logical column first is as follows: –
flights |>
  mutate(
    is_holiday = case_when(
      (month == 1 & day == 1) ~ TRUE,        # New Year's Day
      (month == 7 & day == 4) ~ TRUE,        # 4th of July
      (month == 12 & day == 25) ~ TRUE,      # Christmas
      TRUE ~ FALSE                           # Not a holiday
    ),
    holiday_name = case_when(
      is_holiday ~ case_when(
        (month == 1 & day == 1) ~ "New Year's Day",
        (month == 7 & day == 4) ~ "4th of July",
        (month == 12 & day == 25) ~ "Christmas",
        TRUE ~ NA_character_
      ),
      TRUE ~ NA_character_
    ),
    .keep = "used"
  )
# A tibble: 336,776 × 4
month day is_holiday holiday_name
<int> <int> <lgl> <chr>
1 1 1 TRUE New Year's Day
2 1 1 TRUE New Year's Day
3 1 1 TRUE New Year's Day
4 1 1 TRUE New Year's Day
5 1 1 TRUE New Year's Day
6 1 1 TRUE New Year's Day
7 1 1 TRUE New Year's Day
8 1 1 TRUE New Year's Day
9 1 1 TRUE New Year's Day
10 1 1 TRUE New Year's Day
# ℹ 336,766 more rows