Exploring dataset from the International Mathematical Olympiad (IMO), to see the rankings of countries (particularly India) on the medal tally.
#TidyTuesday
{ggflags}
{ggbump}
Author
Aditya Dahiya
Published
September 24, 2024
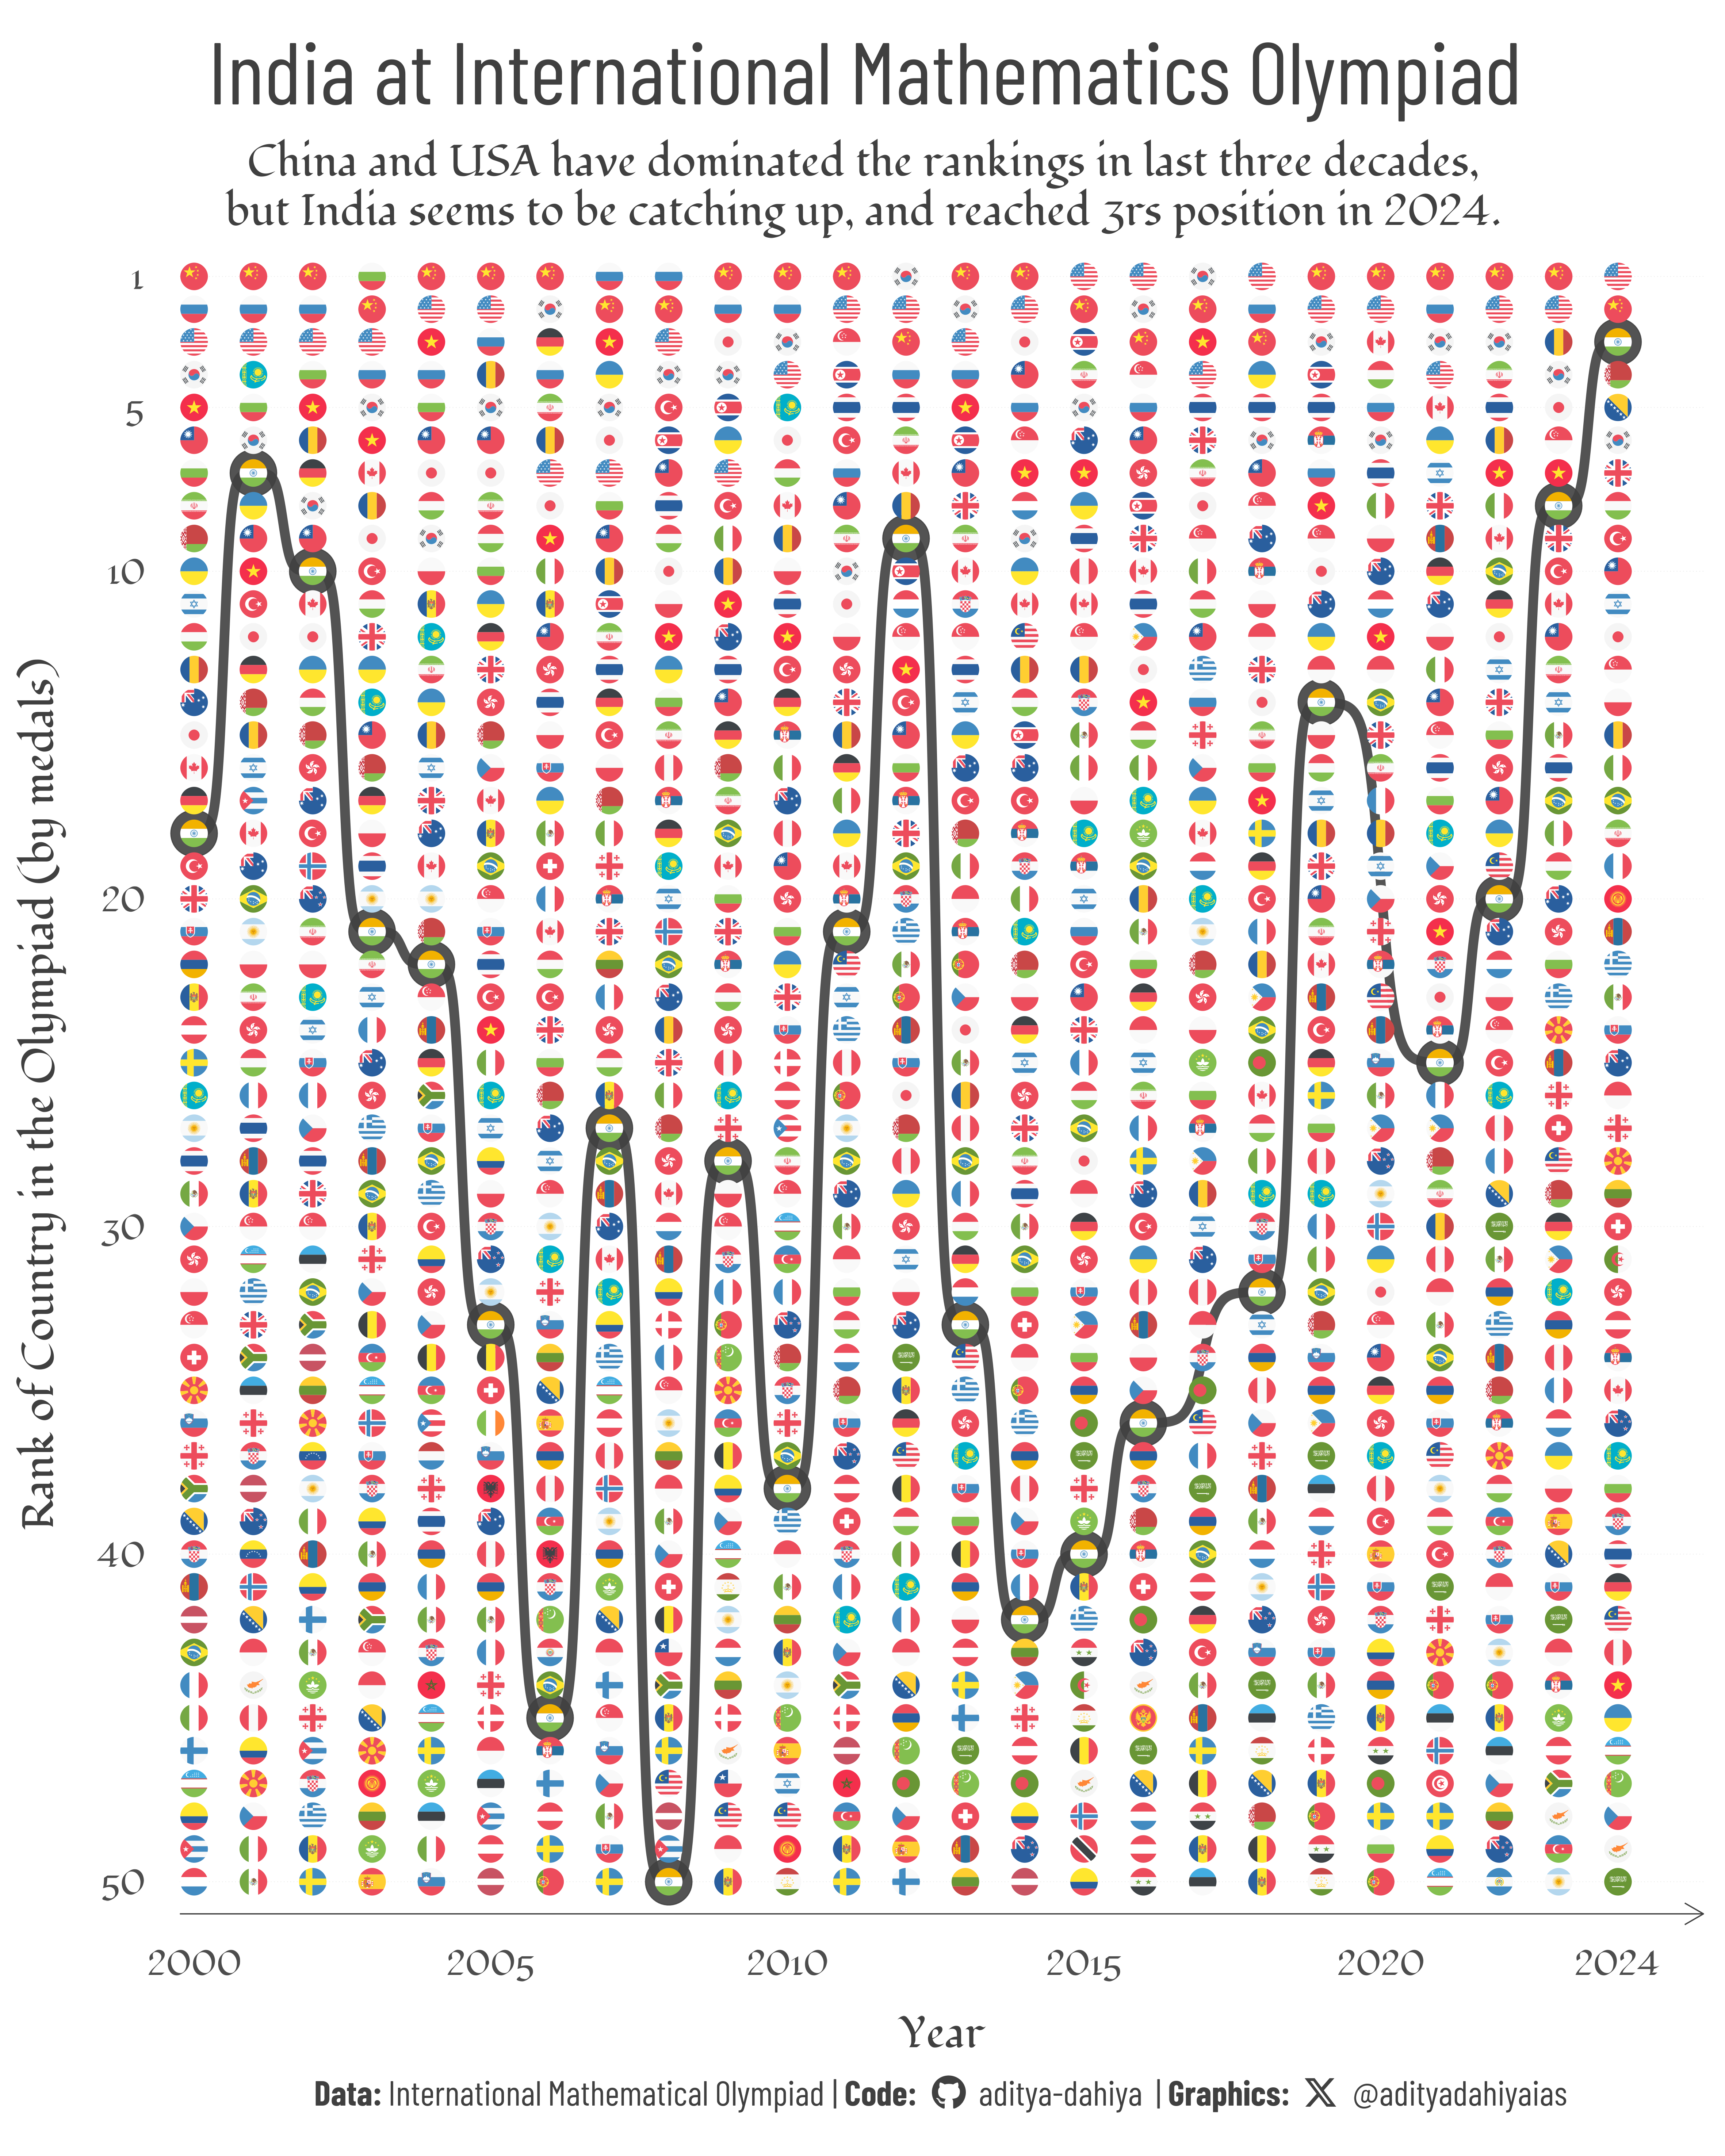
Figure 1: A bump Chart on Ranking of India at the International Mathematics Olympiad (by number of medals won) in last 3 decades. India’s ranking is improving, while China and USA continue to dominate the olympiad.
How I made this graphic?
Loading libraries & data
Code
# Data Import and Wrangling Toolslibrary(tidyverse) # All things tidy# Final plot toolslibrary(scales) # Nice Scales for ggplot2library(fontawesome) # Icons display in ggplot2library(ggtext) # Markdown text support for ggplot2library(showtext) # Display fonts in ggplot2library(colorspace) # Lighten and Darken colourslibrary(patchwork) # Combining plots# Getting the datacountry_results_df <- readr::read_csv('https://raw.githubusercontent.com/rfordatascience/tidytuesday/master/data/2024/2024-09-24/country_results_df.csv')# individual_results_df <- readr::read_csv('https://raw.githubusercontent.com/rfordatascience/tidytuesday/master/data/2024/2024-09-24/individual_results_df.csv')# # timeline_df <- readr::read_csv('https://raw.githubusercontent.com/rfordatascience/tidytuesday/master/data/2024/2024-09-24/timeline_df.csv')# Using ChatGPT, a tibble for ISO 2 Codes for the countries# needed for the flags# Load the necessary packagecountry_labels <-tibble(country =c("People's Republic of China", "Union of Soviet Socialist Republics", "France", "United States of America","Romania", "United Kingdom", "Bulgaria", "Hungary", "Italy", "India", "Brazil", "Luxembourg","Czechoslovakia", "German Democratic Republic", "Islamic Republic of Iran", "Canada", "Norway","Germany", "Australia", "Japan", "Poland", "Austria", "Democratic People's Republic of Korea", "Vietnam","Israel", "Yugoslavia", "Sweden", "Netherlands", "Colombia", "Republic of Korea", "Tunisia", "Morocco","Hong Kong", "Singapore", "New Zealand", "Thailand", "Türkiye", "Mexico", "Argentina", "Cuba", "Ireland","Greece", "Finland", "Kuwait", "Cyprus", "Philippines", "Iceland", "Spain", "Bahrain", "Mongolia", "Belgium", "Switzerland", "Denmark", "Trinidad and Tobago", "Portugal", "Commonwealth of Independent States", "Russian Federation", "Taiwan", "Ukraine", "Latvia", "Kazakhstan", "Armenia", "Belarus", "Slovakia", "Czech Republic", "Georgia", "North Macedonia", "Slovenia", "Macau", "Chile", "South Africa", "Croatia", "Estonia", "Republic of Moldova", "Lithuania", "Peru", "Bosnia and Herzegovina", "Uzbekistan", "Venezuela", "Indonesia", "Serbia and Montenegro", "Azerbaijan", "Kyrgyzstan", "Puerto Rico", "Albania", "Turkmenistan", "Paraguay", "Serbia", "Malaysia", "Tajikistan", "Saudi Arabia", "Bangladesh", "Syria", "Algeria", "Montenegro", "El Salvador"),iso_a2 =c("CN", "SU", "FR", "US", "RO", "GB", "BG", "HU", "IT", "IN", "BR", "LU", "CS", "DD", "IR", "CA", "NO", "DE", "AU", "JP", "PL", "AT", "KP", "VN", "IL", "YU", "SE", "NL", "CO", "KR", "TN", "MA", "HK", "SG", "NZ", "TH", "TR", "MX", "AR", "CU", "IE", "GR", "FI", "KW", "CY", "PH", "IS", "ES", "BH", "MN", "BE", "CH", "DK", "TT", "PT", "CIS", "RU", "TW", "UA", "LV", "KZ", "AM", "BY", "SK", "CZ", "GE", "MK", "SI", "MO", "CL", "ZA", "HR", "EE", "MD", "LT", "PE", "BA", "UZ", "VE", "ID", "CS", "AZ", "KG", "PR", "AL", "TM", "PY", "RS", "MY", "TJ", "SA", "BD", "SY", "DZ", "ME", "SV")) |>mutate(iso_a2 =str_to_lower(iso_a2))
# Font for titlesfont_add_google("Fondamento",family ="title_font") # Font for the captionfont_add_google("Barlow Condensed",family ="caption_font") # Font for plot textfont_add_google("Fondamento",family ="body_font") showtext_auto()bg_col <-"white"text_col <-"grey25"text_hil <-"grey25"bts <-90# Caption stuff for the plotsysfonts::font_add(family ="Font Awesome 6 Brands",regular = here::here("docs", "Font Awesome 6 Brands-Regular-400.otf"))github <-""github_username <-"aditya-dahiya"xtwitter <-""xtwitter_username <-"@adityadahiyaias"social_caption_1 <- glue::glue("<span style='font-family:\"Font Awesome 6 Brands\";'>{github};</span> <span style='color: {text_hil}'>{github_username} </span>")social_caption_2 <- glue::glue("<span style='font-family:\"Font Awesome 6 Brands\";'>{xtwitter};</span> <span style='color: {text_hil}'>{xtwitter_username}</span>")plot_title <-"India at International Mathematics Olympiad"plot_subtitle <-"China and USA have dominated the rankings in last three decades,\nbut India seems to be catching up, and reached 3rd rank in 2024."plot_caption <-paste0("**Data:** International Mathematical Olympiad", " | **Code:** ", social_caption_1, " | **Graphics:** ", social_caption_2 )rm(github, github_username, xtwitter, xtwitter_username, social_caption_1, social_caption_2)