library(terra) # For raster maps handlinglibrary(sf) # For spatial objectslibrary(tidyverse) # Data wranglinglibrary(rayshader) # Rayshader Mapslibrary(elevatr) # Get elevation matrices for plottinglibrary(here) # For locating working directorylibrary(showtext) # Using Fonts More Easily in R Graphslibrary(ggimage) # Using Images in ggplot2library(fontawesome) # Social Media iconslibrary(ggtext) # Markdown Text in ggplot2
Getting the Data on Power Plants in India
Code
# The URL of the databaseurl <-"https://wri-dataportal-prod.s3.amazonaws.com/manual/global_power_plant_database_v_1_3.zip"# Saving a filename for downloading the data intofilename <-basename(url)download.file(url = url,destfile =here("data", "power_plants", filename),mode ="wb")unzip(here("data", "power_plants", filename))list.files(here("data", "power_plants"))
# Creating a matrix of elevation pointselmat <- elev_lambert |> rayshader::raster_to_matrix()# Coverting as below sea level points to sea levelelmat[elmat <0] <-0# Removing missing values of elevation and replacing# them with minimum elevation valueelmat[is.na(elmat)] <-min( elmat,na.rm = T)
Selecting Power Plants that are within India’s borders
# Colours to use for different Power Plant Typescols_vals <-c("#F9A01BFF", "#418FDEFF", "#BA0C2FFF")# Load fontsfont_add_google("Akronim", family ="title_font") # Font for titlesfont_add_google("Saira Extra Condensed", family ="caption_font") # Font for the captionfont_add_google("Redressed", family ="body_font") # Font for plot textshowtext_auto()bg_col <-"white"# Background Colourtext_col <-"#4f2a00"# Colour for the texttext_hil <-"#4f2a00"# Colour for highlighted text# Define Text Sizets =unit(20, units ="cm") # Text Size# Caption stuffsysfonts::font_add(family ="Font Awesome 6 Brands",regular = here::here("docs", "Font Awesome 6 Brands-Regular-400.otf"))github <-""github_username <-"aditya-dahiya"xtwitter <-""xtwitter_username <-"@adityadahiyaias"linkedin <-""linkedin_username <-"dr-aditya-dahiya-ias"social_caption <- glue::glue("<span style='font-family:\"Font Awesome 6 Brands\";'>{github};</span> <span style='color: {text_col}'>{github_username} </span> <span style='font-family:\"Font Awesome 6 Brands\";'>{xtwitter};</span> <span style='color: {text_col}'>{xtwitter_username}</span> <span style='font-family:\"Font Awesome 6 Brands\";'>{linkedin};</span> <span style='color: {text_col}'>{linkedin_username}</span>")# Add text to plot--------------------------------------------------------------plot_title <-"Power Plants in India"subtitle_text <-"A look at Coal, Hydro and Nuclear Power Plants in India, overlaid on the terrain elevation map of India. The coal plants are concentrated in the deccan trap and central India - the site of coal beds. The Hydro-Electric Plants are mostly found in the northern part (Himalayas Mountains) or the southern hills (Western & Eastern Ghats)"plot_subtitle <-paste(strwrap(subtitle_text, 100), collapse ="\n")plot_caption <-paste0("**Data:** Global Power Plant Database | ", "**Graphics:** ", social_caption)g <-ggplot() +geom_tile(data = india_terrain,aes(x = x,y = y,fill = elevation ) ) +geom_sf(data = country_sf,fill ="transparent",col ="#666666FF" ) +geom_sf(data = country_points |>filter(primary_fuel %in%c("Coal", "Hydro", "Nuclear" )),mapping =aes(col = primary_fuel,size = capacity_mw),alpha =0.85, pch =19 ) +scale_x_continuous(expand =expansion(0)) +scale_y_continuous(expand =expansion(0)) +scale_fill_gradient2(low ="white",high ="#802a00",mid ="#996136FF",midpoint =4500,na.value ="transparent",labels = scales::label_number_si(),guide =guide_colourbar(direction ="horizontal",title.position ="top",barwidth =unit(4, "cm"),barheight =unit(2, "mm") )) +scale_colour_manual(values = cols_vals,guide =guide_legend(direction ="horizontal",title.position ="top",keywidth =unit(3, "mm"),override.aes =list(size =3 ) ) ) +scale_size(range =c(0.5, 6),labels = scales::label_number_si(),guide =guide_legend(direction ="horizontal",title.position ="top",keywidth =unit(5, "mm"),override.aes =list(col ="#996136FF" ) ) ) + ggthemes::theme_map() +labs(size ="Capacity (MW)",color ="Fuel",fill ="Elevation (m)",title = plot_title,subtitle = plot_subtitle,caption = plot_caption ) +theme(legend.position ="bottom",plot.caption =element_textbox(family ="caption_font",hjust =0.5,colour = text_col,size =2* ts,margin =margin(0,0,0.4,0,unit ="cm")),plot.title =element_text(hjust =0.5,size =11*ts,family ="title_font",face ="bold",colour = text_hil,margin =margin(1,0,0,0,unit ="cm")),plot.subtitle =element_text(hjust =0.5,size =2.4* ts,family ="body_font",colour = text_col,margin =margin(0,0,0,0,unit ="cm"),lineheight =0.35),plot.background =element_rect(fill = bg_col,color = bg_col,linewidth =0),plot.title.position ="plot",legend.text =element_text(size =2* ts,family ="body_font",colour = text_col,margin =margin(0,0,0,0),hjust =0),legend.title =element_text(size =63,family ="body_font",colour = text_col,margin =margin(0,0,0,0,unit ="mm"),hjust =0.5),legend.margin =margin(0, 0.3, 0.5, 0.3, "cm"),legend.spacing.x =unit(1, "mm"),legend.spacing.y =unit(1, "mm"),legend.box ="horizontal",legend.key =element_rect(fill = bg_col,colour = bg_col),legend.background =element_rect(fill = bg_col) )ggsave(filename = here::here("docs", "india_powerplants.png"),plot = g,width =20, height =26, units ="cm",bg = bg_col)
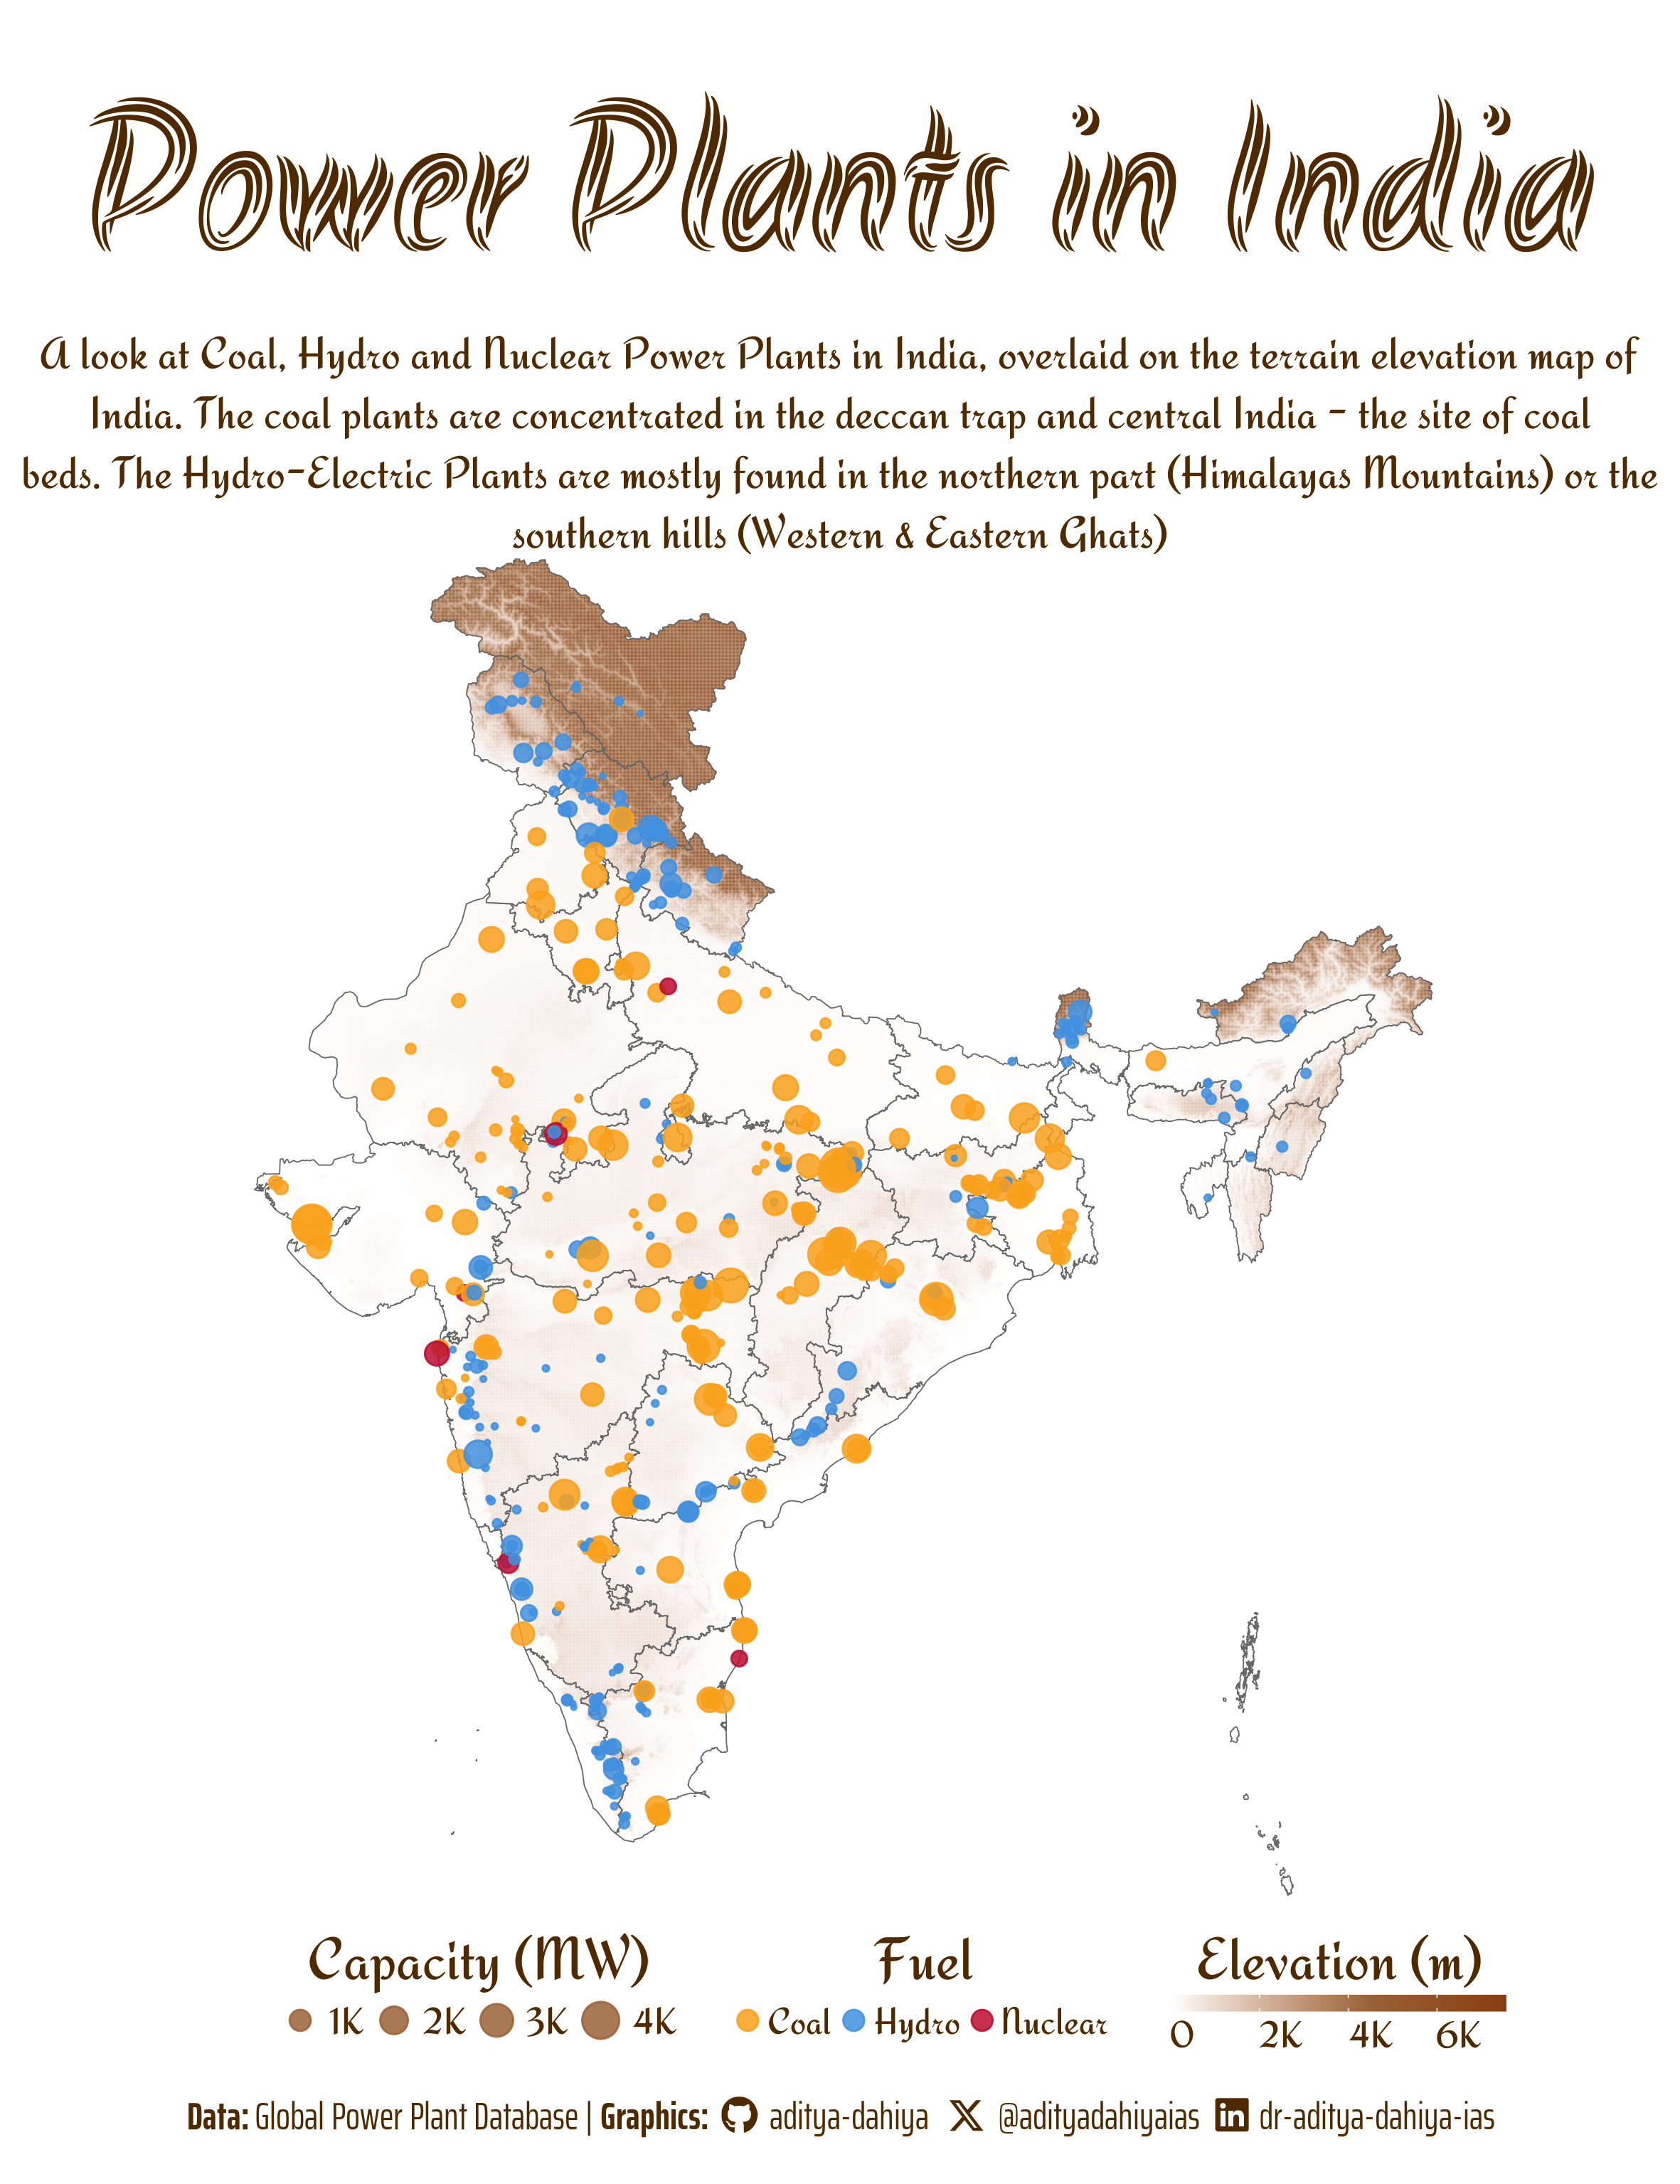
Figure 1: Map of India with a look at Coal, Hydro and Nuclear Power Plants in India, overlaid on the terrain elevation map of India. The coal plants are concentrated in the deccan trap and central India - the site of coal beds. The Hydro-Electric Plants are mostly found in the northern part (Himalayas Mountains) or the southern hills (Western & Eastern Ghats)