# Code used for Chandigarh
cty <- opq("Chandigarh")

cty_roads <- cty |>
  add_osm_feature(key = "highway") |>
  osmdata_sf()

very_minor <- cty_roads$osm_lines |>
  filter(highway %in% c("footway", "track", "path", "tertiary_link", "secondary_link", "primary_link", "trunk_link"))

minor_road <- cty_roads$osm_lines |>
  filter(highway %in% c("residential", "tertiary", "secondary"))

main_roads <- cty_roads$osm_lines |>
  filter(highway %in% c("primary", "trunk"))

cty_map <- ggplot() +
  geom_sf(
    data = very_minor,
    linewidth = 0.1,
    alpha = 0.2
  ) +
  geom_sf(
    data = minor_road,
    linewidth = 0.3,
    alpha = 0.5
  ) +
  geom_sf(
    data = main_roads,
    linewidth = 0.6,
    alpha = 0.8
  ) +
  labs(title = "Chandigarh") +
theme_void()

ggsave("docs/cty_map.png",
  plot = cty_map,
  device = "png",
  width = 1800,
  height = 1800,
  units = "px"
)Making road-maps of cities with Open Street Maps
A user-created function to create street art maps in a single line of code
Here, I have tried to create a user friends single line of code fucntion to recreate street art maps using OpenStreetMaps. The inspiration is from the Github Workflow of Evgeny Politov. Credits to him for the majority of the code here, taken from his insights explained in this article on medium.com.

Now, I create a function draw_street_map() to do this task and automate for other cities. If you want, simply copy paste the function, and use it for any city.
# Code used for Chandigarh

draw_street_map <- function(cityname, filename){
  require(osmdata)
  require(tidyverse)
  require(sf)

  cty <- osmdata::opq(cityname)

  cty_roads <- cty |>
  add_osm_feature(key = "highway") |>
  osmdata_sf()

  very_minor <- cty_roads$osm_lines |>
    filter(highway %in% c("footway", "track", "path",
                          "tertiary_link", "secondary_link",
                          "primary_link", "trunk_link"))

  minor_road <- cty_roads$osm_lines |>
    filter(highway %in% c("residential", "tertiary",
                          "secondary"))

  main_roads <- cty_roads$osm_lines |>
    filter(highway %in% c("primary", "trunk"))

  cty_map <- ggplot() +
    geom_sf(
      data = very_minor,
      linewidth = 0.1,
      alpha = 0.2
    ) +
    geom_sf(
      data = minor_road,
      linewidth = 0.3,
      alpha = 0.5
    ) +
    geom_sf(
      data = main_roads,
      linewidth = 0.6,
      alpha = 0.8
    ) +
    labs(title = cityname) +
  theme_void()

  ggsave(filename,
    plot = cty_map,
    device = "png",
    width = 1800,
    height = 1800,
    units = "px")

}draw_street_map("Panchkula", "docs/panchkula.png")
draw_street_map("Faridabad", "docs/faridabad.png")
draw_street_map("Gurugram", "docs/gurugram.png")
Now, we create a Gurugram city centre map with some tweaks in the code. Can use opq() or the Open Street Maps’ Export Interface here to get the latitude and longitude of any portion of any city and then just paste it here.
cty <- opq("Gurugram")

cty$bbox <- "28.4071, 76.9881, 28.5106, 77.1051"

cty_roads <- cty |>
  add_osm_feature(key = "highway") |>
  osmdata_sf()

very_minor <- cty_roads$osm_lines |>
  filter(highway %in% c("footway", "track", "path", "tertiary_link", "secondary_link", "primary_link", "trunk_link"))

minor_road <- cty_roads$osm_lines |>
  filter(highway %in% c("residential", "tertiary", "secondary"))

main_roads <- cty_roads$osm_lines |>
  filter(highway %in% c("primary", "trunk"))

cty_map <- ggplot() +
  geom_sf(
    data = very_minor,
    linewidth = 0.1,
    alpha = 0.2
  ) +
  geom_sf(
    data = minor_road,
    linewidth = 0.3,
    alpha = 0.5
  ) +
  geom_sf(
    data = main_roads,
    linewidth = 0.6,
    alpha = 0.8
  ) +
  labs(title = "Gurugram City (Central Area)") +
theme_void()

ggsave("docs/gurugram_city_centre.png",
  plot = cty_map,
  device = "png",
  width = 1800,
  height = 1800,
  units = "px"
)
Lastly, I create a simple custom function draw_custom_street_map() to provide custom coordinates and plot these maps. Feel free to use this in your workflows!
As an example, I create map for the NIT and Old Faridabad town area of Faridabad City.
Code
draw_custom_street_map <- function(cityname, filename,
                                   latitude_min, latitude_max,
                                   longitude_min, longitude_max){
  require(osmdata)
  require(tidyverse)
  require(sf)

  cty <- osmdata::opq(cityname)

  cty$bbox <- paste0(latitude_min, ", ", longitude_min, ", ",
                     latitude_max, ", ", longitude_max)

  cty_roads <- cty |>
  add_osm_feature(key = "highway") |>
  osmdata_sf()

  very_minor <- cty_roads$osm_lines |>
    filter(highway %in% c("footway", "track", "path",
                          "tertiary_link", "secondary_link",
                          "primary_link", "trunk_link"))

  minor_road <- cty_roads$osm_lines |>
    filter(highway %in% c("residential", "tertiary",
                          "secondary"))

  main_roads <- cty_roads$osm_lines |>
    filter(highway %in% c("primary", "trunk"))

  cty_map <- ggplot() +
    geom_sf(
      data = very_minor,
      linewidth = 0.1,
      alpha = 0.2
    ) +
    geom_sf(
      data = minor_road,
      linewidth = 0.3,
      alpha = 0.5
    ) +
    geom_sf(
      data = main_roads,
      linewidth = 0.6,
      alpha = 0.8
    ) +
    labs(title = cityname) +
  theme_void()

  ggsave(filename,
    plot = cty_map,
    device = "png",
    width = 1800,
    height = 1800,
    units = "px")

}

# A box coordinates of box area of NIT and Old Faridabad towns
latitude_min <- 28.3687
latitude_max <- 28.4291
longitude_min <- 77.2783
longitude_max <- 77.3397draw_custom_street_map("Faridabad", "faridabad.png",
latitude_min = 28.3687,
latitude_max = 28.4291,
longitude_min = 77.2783,
longitude_max = 77.3397)
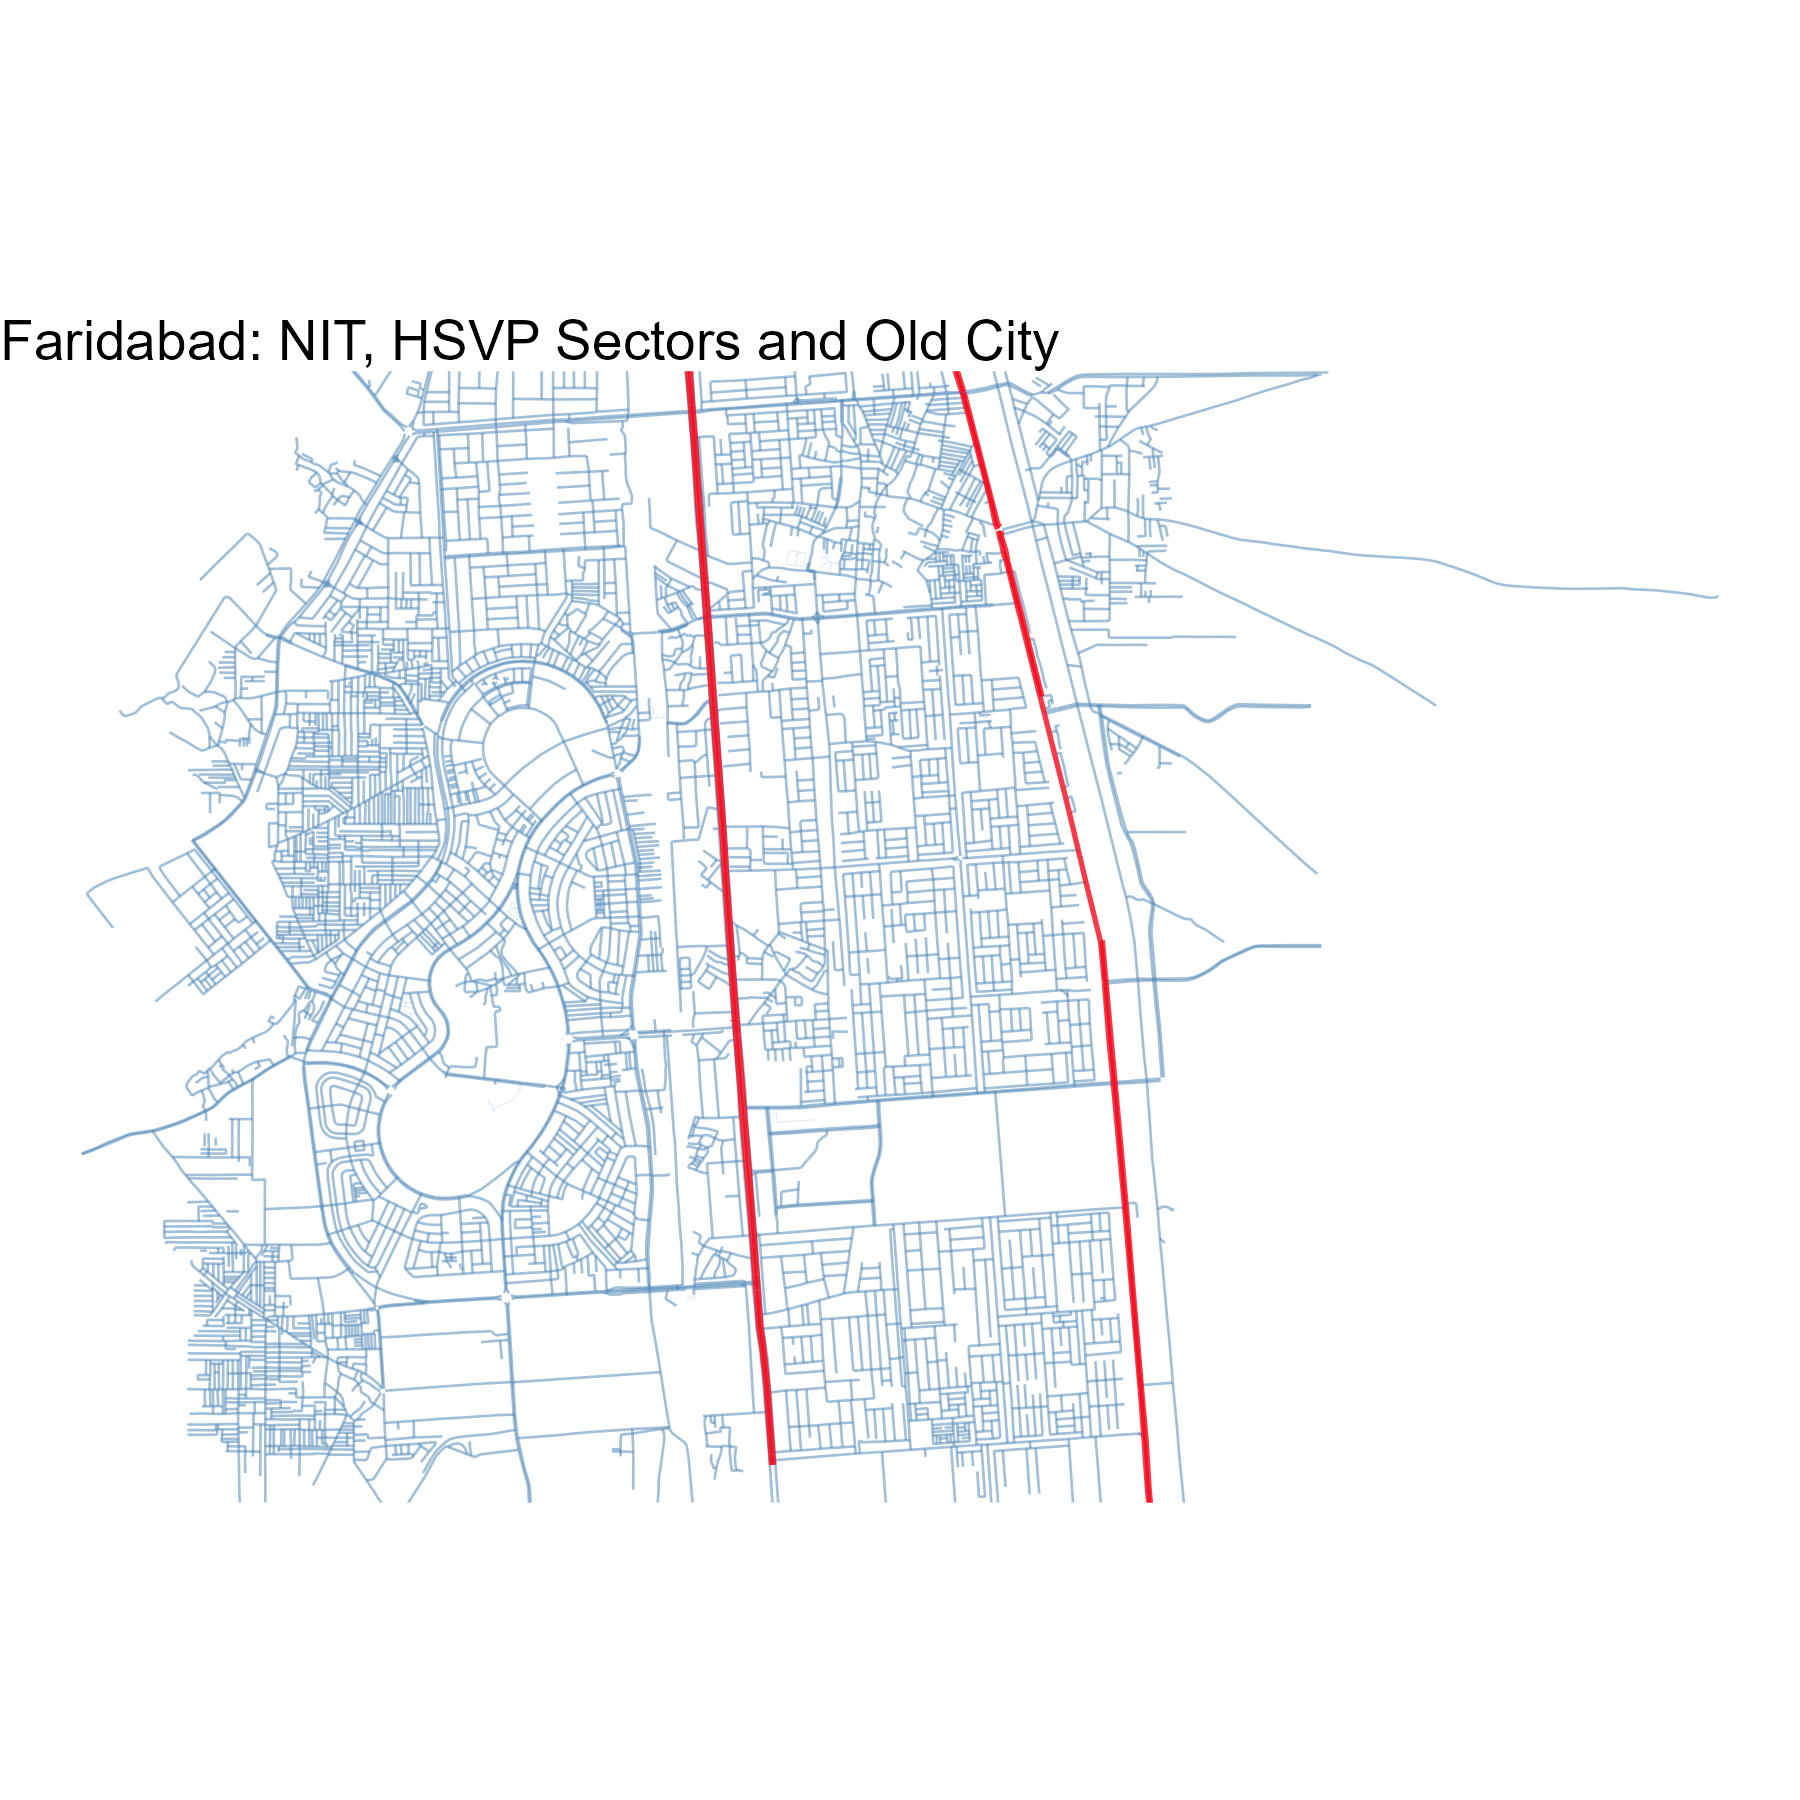
Remember, with some basic ggplot2 knowledge, you can always change the colours and various aesthetics of these maps. An example is shown below: –
Code
require(osmdata)
require(tidyverse)
require(sf)

cty <- osmdata::opq("Faridabad")

cty$bbox <- "28.3687, 77.2783, 28.4291, 77.3397"

cty_roads <- cty |>
  add_osm_feature(key = "highway") |>
  osmdata_sf()

very_minor <- cty_roads$osm_lines |>
    filter(highway %in% c("footway", "track", "path",
                          "tertiary_link", "secondary_link",
                          "primary_link", "trunk_link"))

minor_road <- cty_roads$osm_lines |>
    filter(highway %in% c("residential", "tertiary",
                          "secondary"))

main_roads <- cty_roads$osm_lines |>
    filter(highway %in% c("primary", "trunk"))

cty_map <- ggplot() +
    geom_sf(
      data = very_minor,
      linewidth = 0.1,
      alpha = 0.2,
      col = "steelblue"
    ) +
    geom_sf(
      data = minor_road,
      linewidth = 0.3,
      alpha = 0.5,
      col = "steelblue"
    ) +
    geom_sf(
      data = main_roads,
      linewidth = 0.6,
      alpha = 0.8,
      col = "#f20a1d"
    ) +
    labs(title = "Faridabad: NIT, HSVP Sectors and Old City") +
  theme_void() +
  scale_y_continuous(limits = c(28.3689, 28.427))

ggsave("faridabad_col.png",
    plot = cty_map,
    device = "png",
    width = 1800,
    height = 1800,
    units = "px")